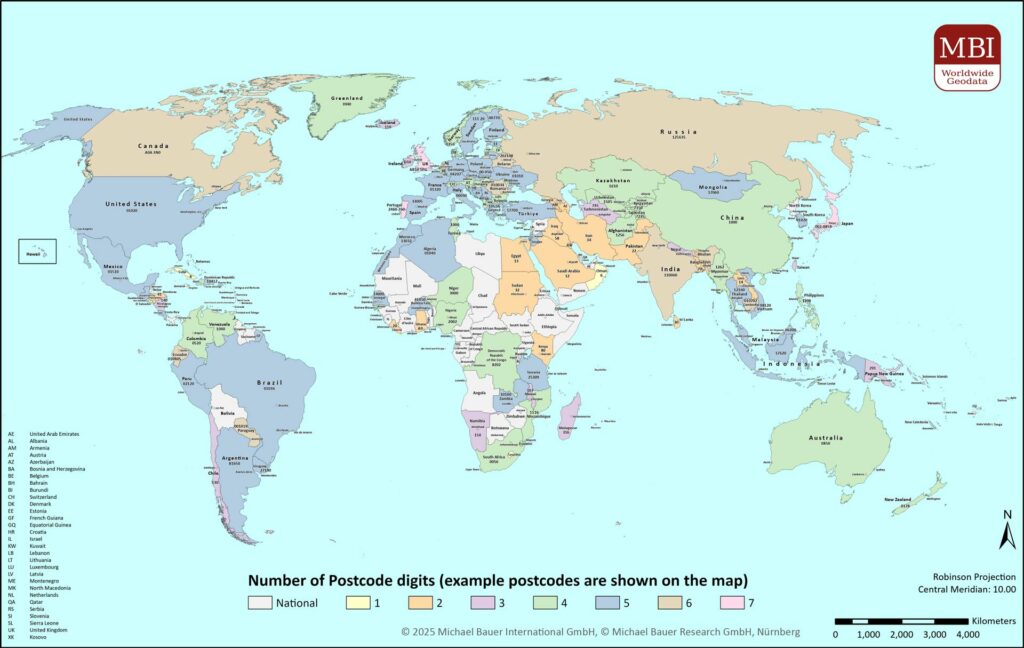
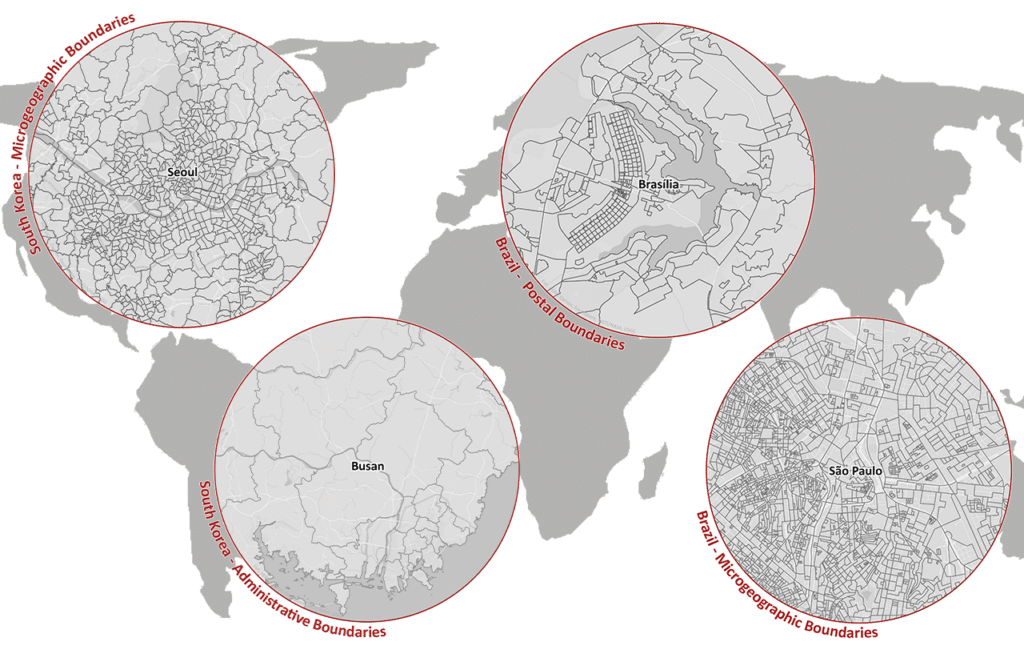
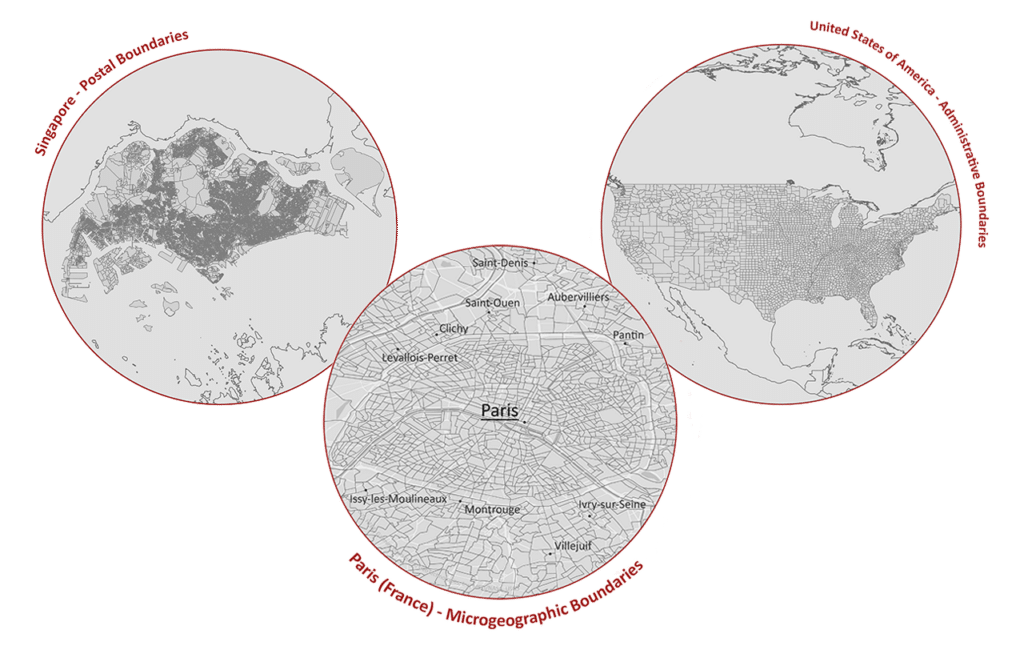
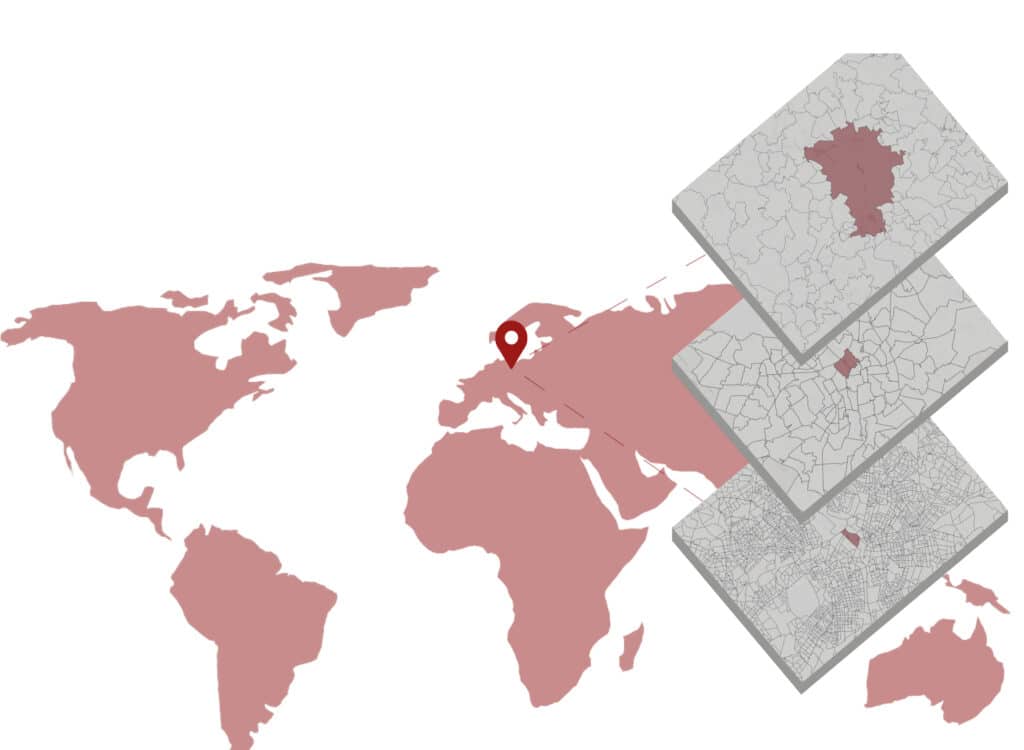
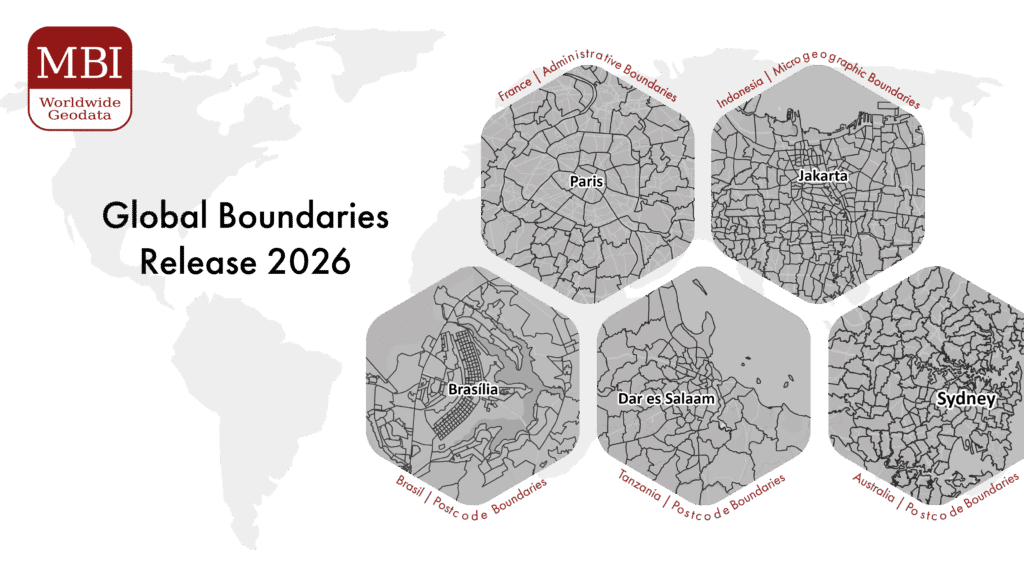
2023 update of global boundaries data: Improving accuracy for businesses worldwide

Karlsruhe, April 5th 2023: As the world becomes increasingly interconnected, accurate data has become crucial for businesses operating on a global scale. Our global boundaries support companies in understanding their market reach, targeting customers more effectively, and managing their operations in a more efficient manner.

The 2023 release of our updated global boundaries data is a significant advancement for companies with a global footprint. By using this data, companies can gain a better awareness of their markets and use that knowledge to make more informed decisions about how to develop and manage their operations.

Learn more in our full press release…

share

Release 2022 – More than 2.8 million postcode areas in 248 countries worldwide

Illustration showing the postal, admin and microgeographic boundaries for Belin, Germany as an example

Karlsruhe, April 21st, 2022: With the 2022 release, our annual update of the data vintage for a large number of countries in Europe, North America, South America, Africa, Asia, and Oceania has been published. In addition to the adaptation to the most recent data level, numerous administrative, postal and microgeographic area boundaries have been revised or newly added.

As of now, additional digital boundaries are available for the following levels:

  • Turkey (Mahalleler),
  • Portugal (7-digit postcode areas),
  • China (Townships for Beijing and Shanghai),
  • Serbia (Statistical Districts),
  • Algeria (Communes),
  • Netherlands (6-digit postcode areas),
  • United Kingdom (Unit Postcodes) and
  • Malaysia (5-digit postcode areas)

Due to the seamless coverage of postcode and administrative area boundaries, country borders fit together seamlessly without overlaps or gaps to enable cross-country analyses.

As a manufacturer of international data, MBI knows the challenges that are placed on the data required. This is why the world’s leading companies across all industries trust and value the quality and timeliness of our data. We ensure these standards through the most precise research, thorough monitoring of current developments, strict and continuous quality controls, as well as annual updates and extensive upgrades.

From Release 2021 to Release 2022, the format of our digital boundaries has been further optimized. In addition to the existing standard data formats .shp (Esri), .tab (MapInfo), MIF/MID and .gdp (GeoDataBase), our global area boundaries are now also available in .geojson and .tabx formats. Since the 2022 release, all delivery formats are OGC-compliant in order to guarantee good compatibility for use in different GIS systems.

The update also includes the addition of City Points and Additional Names to the database. City Points contain valuable information on the geographical location and size of cities with more than 50,000 inhabitants. Additional Names contain country-specific information on the names and languages available in each country, as well as their language and writing systems, which can be used to support query and analysis processes in the country-specific writing system, for example.

An up-to-date database is essential for efficient planning. With our globally consistent and comparable geodata, we provide our customers and partners with a solid basis for well-founded business decisions. Ray Roberts-York, Managing Director of Michael Bauer International GmbH, explains in this context: “Especially in recent years, there’s so much change, and the world around us is evolving faster than ever. To keep up with these developments, an up-to-date database is of great importance. Through regular revisions and adjustments of the data vintage, our data reflects the dynamically changing environmental conditions and supports companies across the globe in making complex decisions.”

Matching the global area boundaries, MBI offers market data (purchasing power, consumer typologies, sociodemographic data, consumer spending, etc.) at administrative, postal, and microgeographic levels. Together with postcode, administrative or microgeographic area boundaries, these enable even more effective and efficient decision-making. For more information, please contact our Sales team. The full press release can be found here.

MBI data offering in numbers, Release 2022

Our experts are continuously working on the improvement, adaptation and micro-level expansion of the global map and databases.

Current number of countries worldwide: 248

Current number of area boundaries (polygones) worldwide (per area level):
Postal: over 2,819,000
Administrative: over 198,000
Microgeographic: over 3,035,000

share

Release 2022 of area boundaries for Europe

Update of the European digital boundaries

In our new release 2022 we publish updates of the administrative, postal and microgeographic digital boundaries for Europe. The updated layers have been adapted to the most recent data level across Europe and extended with additional layers.

For the 2022 release, “City Points” are included as a standard addition. City Points provide you with valuable insights on the geographic location and size of all cities with more than 50,000 inhabitants.

Digital area boundaries help you to display and analyze spatial areas on a map. They can be easily matched and attributed with company internal data (e.g. sales figures, sales areas) or our global market data (purchasing power, consumer types, sociodemographic data, etc.) on administrative, postal and microgeographic levels.

Contact our sales team for more information on the geographic levels of each country and a non-binding quote.

share

Asia – number of small area maps continues to grow

MBI’s range of small area maps continues to grow. In the Asian region in particular, more and more detailed analyzes can be carried out.

Examples for small area maps /micro areas (country / number of areas / area level)

Indonesia / 81.903 / Kelurahan
South-Korea / 5.048 / Dong
Malaysia / 1.191 / Mukim
Singapore / 323 / Subzones

With area boundaries, catchment areas can be visualized and the question “Where do my customers come from?” can be answered. By linking the area boundaries with company-internal data, spatial correlations can be depicted. MBI data on for example population and purchasing power can also be enriched individually.

Learn more about MBI area boundaries…

share

To Content To Menu