
SELF-EXPLAINING POLITICAL RISK DATA
With our MBI CONIAS Risk Intelligence database, we offer the service of a “translation of values into text” – to give versed as well as less experienced analysts quick access to the data. In addition, we also provide a kind of interpretation for assessing the consequences of political risks. This allows you to analyze the current situation in different regions in order to assess the extent of politically motivated, physical violence. The data is given a temporal context for adequate risk management.
Instead of a snapshot, our self-explaining political risk data provides insights into current risk and risk development, trend development as well as details and conflicts per region. With MBI CONIAS Risk Intelligence, you get these insights and trend forecasts for numerous countries worldwide in order to be able to assess political risks and their impact.
CONIAS SUSAFE – OUR BASIC PRODUCT
Analysis of the current situation and placement in a temporal context
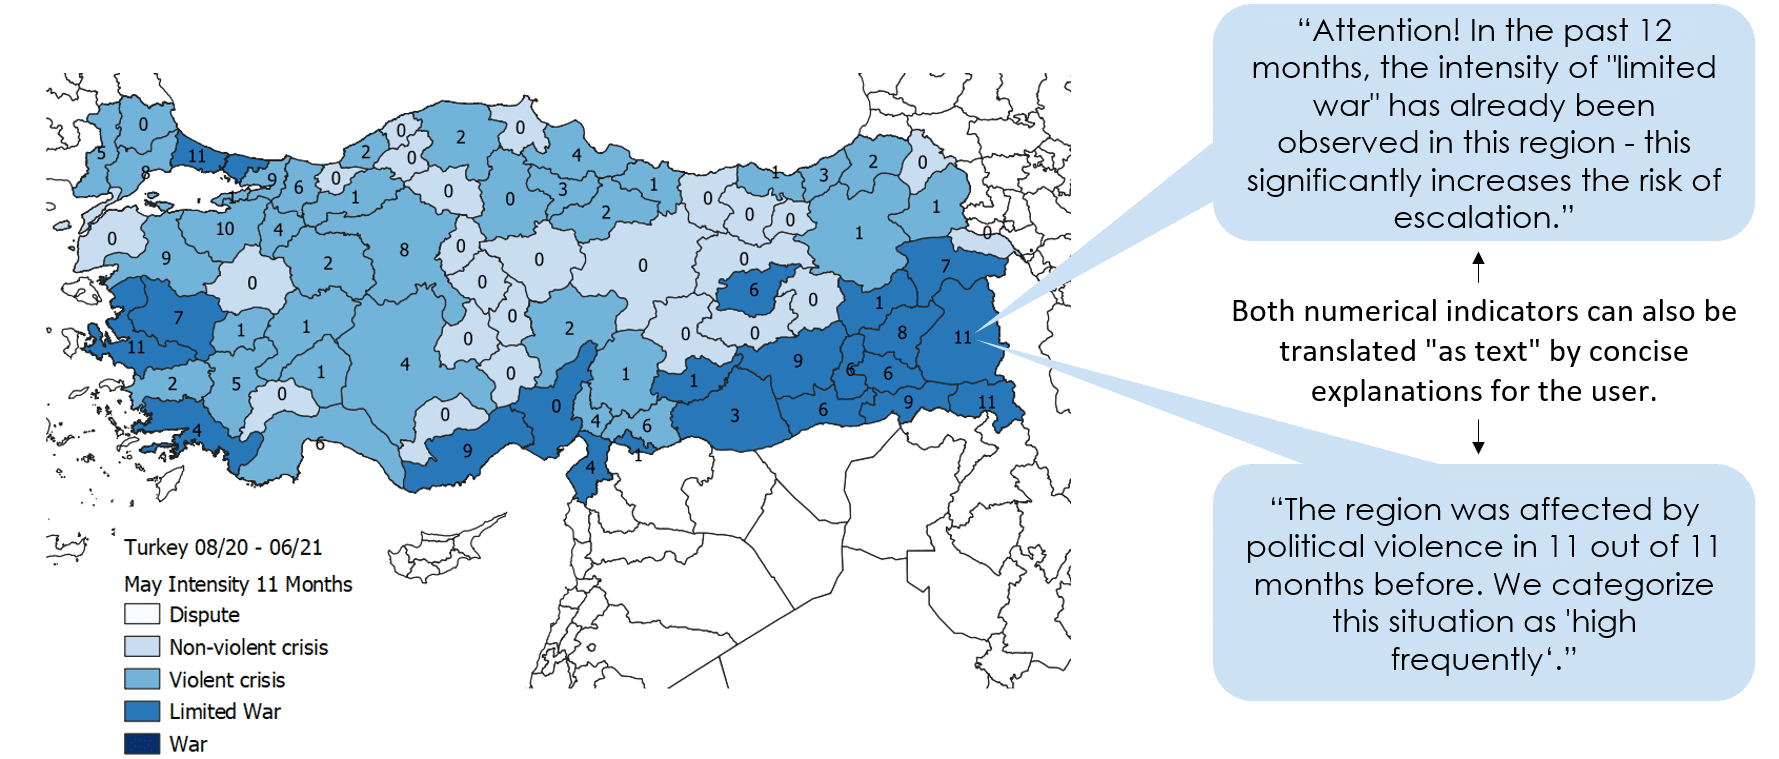
With our basic product CONIAS SUSAFE you have the opportunity to analyze the current situation in order to grasp the extent of politically motivated physical violence. It is recommended for a general overview of political risk.
CONIAS SUSAFE shows, in addition to the highest observable intensities of a region, the total number of violent conflicts that took place in a province.
For adequate risk management, the current situation is also placed in a temporal context. Risk managers and analysts are not only interested in an assessment of the current conflict situation and its impact on physical security in the different regions. Furthermore, they need to know how representative this month is for the country. For this purpose, we consider the highest conflict intensity and the number of months with violent conflict per region, but also the current intensity and the median of the last 12 months.
CONIAS SUSAFE Calculated Trends – Add-On for the basic product
Trend forecast
Predicting the future completely correctly and thus accurately naming all risks will probably remain a dream. But just by observing the behavior of conflicts in each affected region, the risk of political violence can be correctly predicted for more than 80% of all nearly 4,000 regions studied. We are working on further models to continuously optimize this rate.
Therefore, the CONIAS SUSAFE Calculated Trends contain the trend forecast as an add-on to the CONIAS SUSAFE basic product. It includes, among other things, the calculated trend for the current month and the next three months. It is recommended for a general overview and long-term risk management using trend forecasts.
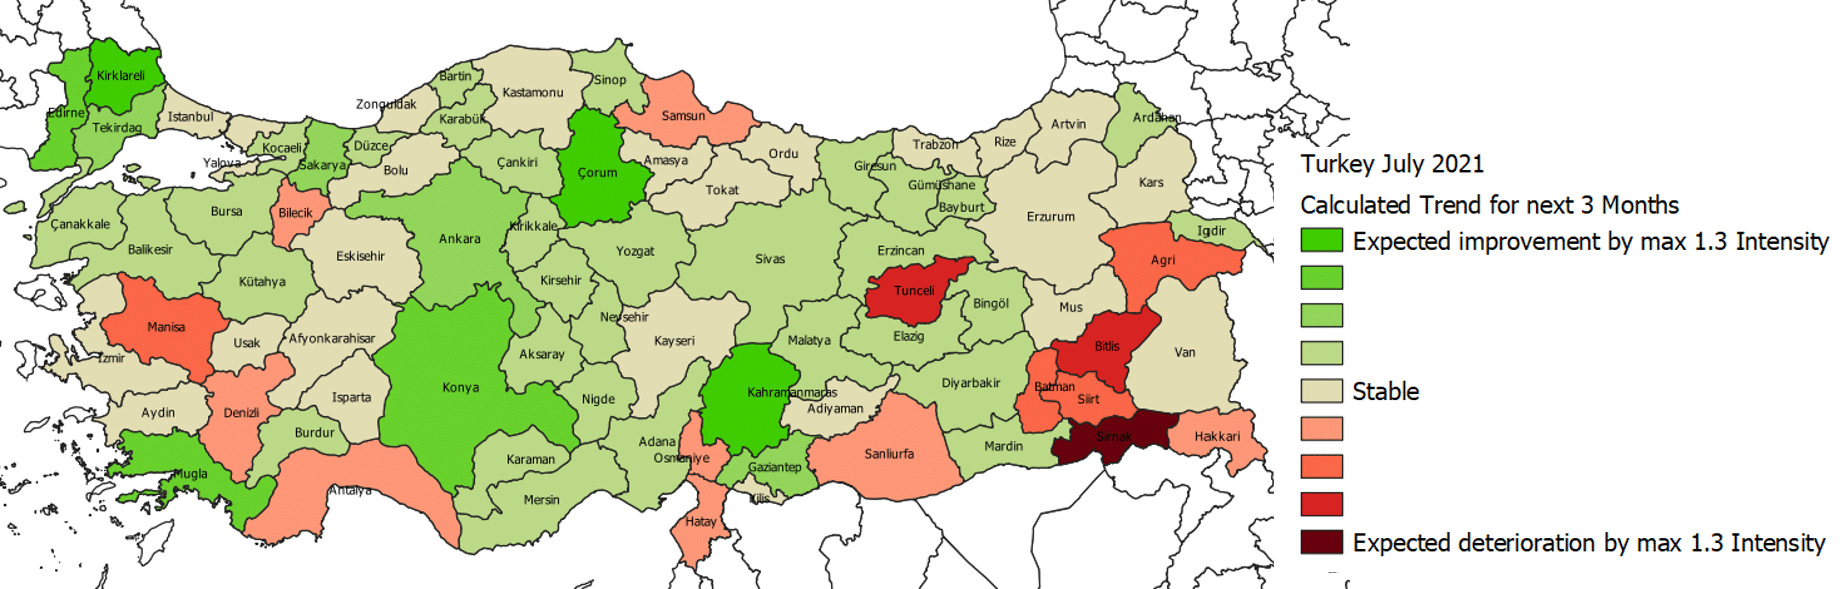
Calculated trend values are an extremely useful tool for determining the magnitudes of political risks. But – similar to weather forecasting – the prediction accuracy decreases the further the period of interest lies in the future. This is where our product CONIAS SURE might be of interest.
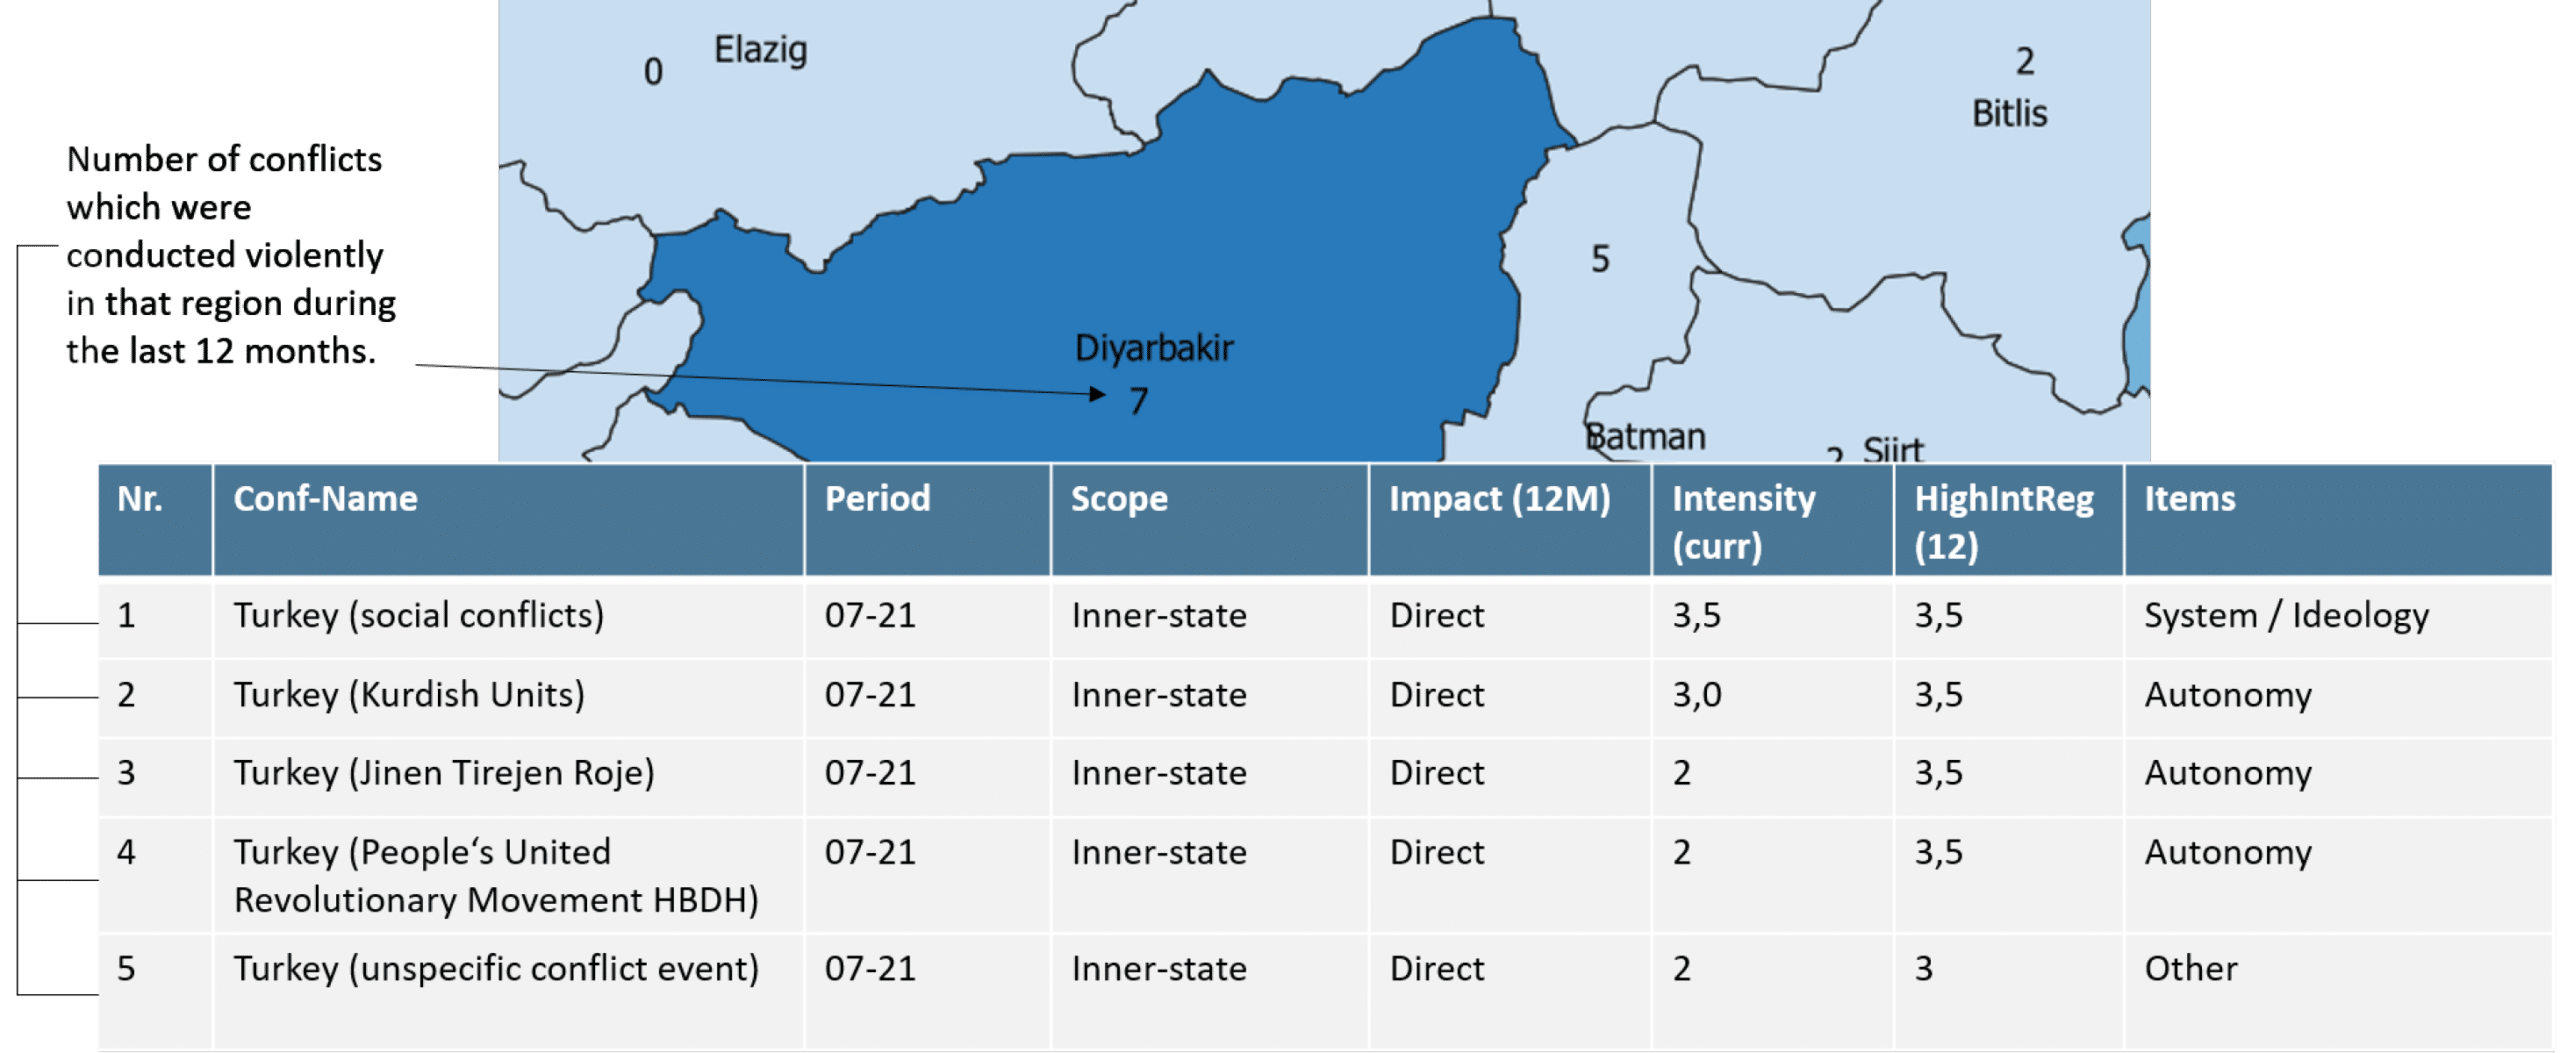
But a look at the details can also provide further understanding of a region’s conflict situation and show which news items to pay particular attention to in the future.
CONIAS SUSAFE Conflict Insights – our comprehensive product
Overview of all conflicts which affect the political risk
Our comprehensive product, CONIAS SUSAFE Conflict Insights, contains our CONIAS SUSAFE basic product, the add-on CONIAS SUSAFE Calculated Trends as well as CONIAS SUSAFE Conflict Insights and thus includes our entire range of services. It is recommended for detailed analyses of conflict situations, political risk, and trend forecasts as part of short- and long-term risk management.
With the help of CONIAS SUSAFE Conflict Insights, conflict activity can be analyzed for every possible ongoing conflict. The product thus provides more in-depth insights into the ongoing conflicts in a region and their background.
Information about ongoing conflicts in a region is essential for empirically based risk management. The evaluation possibilities as well as the gain in knowledge are enormous, but also require deeper understanding of political conflicts and their behavior.
Key Differentiators

Globally consistent and comparable data

Strict quality control

Individual consulting and support

Continuous updating after every release

100 % GDPR compliant
DATA FORMATS
cvs | json
Geo Formats:
Esri Shapefile (.shp) | Esri Geodatabase (.gdb) | MapInfo (.tab) | MapInfo MIF/MID | GeoParquet (.parquet) | GeoPackage (.gpkg) | more on request
UPDATES
Up to twelve updates in a year (on the 15th of the following month) can be delivered monthly or quarterly.
TELL US WHERE YOU ARE HEADING.
WE WILL GLADLY ASSIST YOU IN SELECTING THE DATA NEEDED TO REACH YOUR GOAL.
Didn’t find what you are looking for or have another question? Please do not hesitate to contact us!
Our experts will be happy to advise you individually and without obligation on which data you can use to create added value for your company and realize savings.
In addition to further explanatory data, which clients can book, we also recommend attending our MBI CONIAS Academy.
Discover More


Is it possible to detect political risk early? In this video, we explore this critical question and uncover good news.

Your supply chain is only as strong as its weakest link. Make reliable predictions and better informed decisions.

Identifying and mitigating political risks along the supply chain

Sign up for our MBI CONIAS Risk Intelligence Newsletter to never miss a thing from the world of political risk.

What are the underlying indications for the CONIAS values? Why did the CONIAS SUSAFE index score increase ...

Never before has there been so much early warning and seldom have experts been so unanimous: The shortage ...

Our Chief Data Scientist for Political Risk, Dr. Nicolas Schwank, has been a guest on the Business Diplomacy Today Podcast.