
Trends for Population and Purchasing Power
What is a Trend Analysis?
Trend analysis is an important approach to predicting future developments in different industries and making decisions based on these predictions. It enables companies to prepare for the future by forecasting trends and developments in different areas. This process involves examining data to identify behaviors and patterns that indicate future developments.
What Are MBI Trends?
The current purchasing power-related and socio-demographic data from MBI are suitable for numerous analyses, but only ever depict a point in time. In order to be able to analyze changes, developments and trends, however, a period of time must be observed. MBI Trends are available for our Population and Purchasing Power Data, as well as for Consumer Spending by Product Groups. They can be licensed as an add-on when purchasing one of these three products.
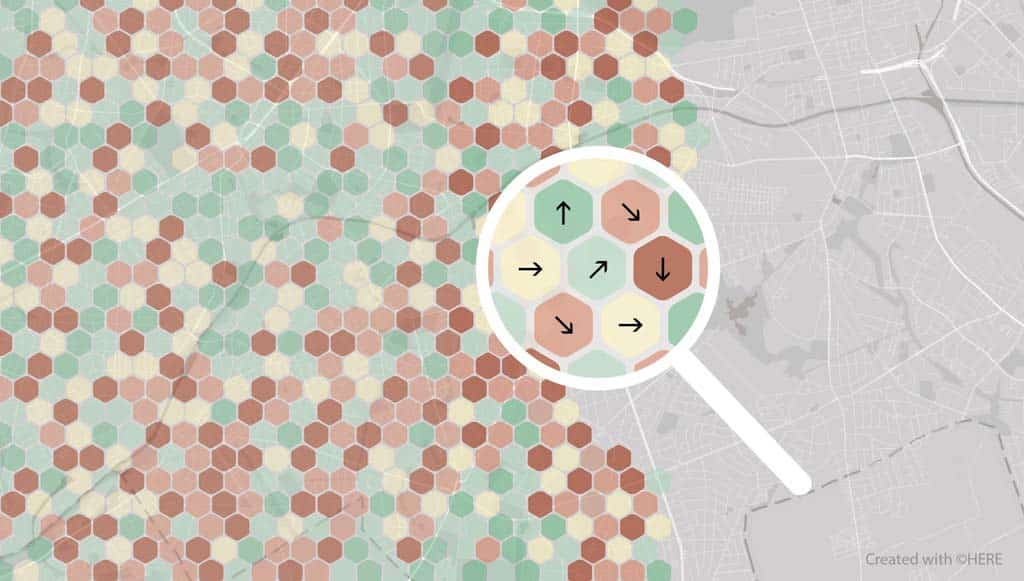
Our MBI trends provide information on whether the key figure under consideration has increased strongly, moderately, remained unchanged, moderately decreased, or strongly decreased compared to the last MBI data update. This allows you to perform trend analyses without licensing the complete data sets from the last years.
How can your company benefit from a trend analysis?
The trend analysis in combination with population and purchasing power data can help companies better understand the needs and behaviors of consumers and respond to changing market conditions. When companies incorporate trends in population and purchasing power data into their planning, they can gain valuable insights into the future demand and consumption behavior of their target group. Additionally, they can better assess the demand for certain products and services and respond accordingly.
One example is the analysis of sales data and population statistics to identify the needs and preferences of customers in specific geographic regions and to develop marketing campaigns tailored to these target groups. Furthermore, product ranges can be optimized and pricing strategies adjusted accordingly.
Overall, the combination of trend analysis with population and purchasing power data is a valuable tool for companies to align their business strategy with future market conditions and thus gain a competitive advantage.
Sample of the Data Structure for MBI Trends
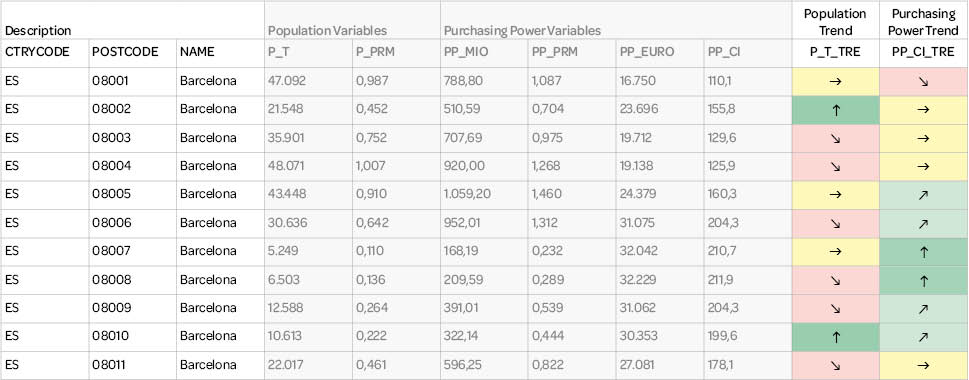
CTRYCODE – two digit country code by ISO 3166
POSTCODE – Postcode
NAME – name of the most populous administrative area
P_TRE – Population: short-term trend compared to calculation of the last release
PP_CI_TRE – Purchasing power: short-term trend compared to calculation of the last release
P_T Population (Nighttime) year average: total number
P_PRM Population (Nighttime) year average: per mill of country
PP_MIO Purchasing Power: million Euro
PP_PRM Purchasing Power: per mill of country
PP_EURO Purchasing Power: Euro per capita
PP_CI Purchasing Power: index (country eq. 100)
↑ significant growth (3 % and above)
↗ slight growth (1 % to 3 %)
→ stagnation (-1 % to 1 %)
↘ slight decline (-3 % to -1 %)
↓ significant decline (below -3 %)
N no value – trend not available due to, i.e., secrecy
The columns “Description” and “MBI Trends” belong to the add-ons MBI Trends Purchasing Power and MBI Trends Population. In the example shown in the table, both main products Population and Purchasing Power have been licensed, as well as both associated add-ons for MBI Trends.

USE CASE
A consumer goods company is considering expanding its business into a new region. By using population size trend data, the company can identify areas that are experiencing growth and therefore may have a growing number of potential customers. In addition, by looking at purchasing power trends, the company can gain insight into whether the region is attractive as a sales market and whether the region’s economic strength is sufficient to generate demand for the products it offers.
Building on the analyses, the company can better tailor its product offerings and marketing strategies to the local consumer group. For example, if the region has a growing purchasing power for the product group “Durables for recreation and culture”, the company can focus on providing these goods. If purchasing power and population decline, the company may decide not to expand its business in this area. Alternatively, they may need to adjust their product offerings and marketing strategies to better match the needs and preferences of the remaining consumer group.
Key Differentiators

Globally consistent and comparable data

Strict quality control

Individual consulting and support

Continuous updating after every release

100 % GDPR compliant
COUNTRY AVAILABILITY
Europe | North America | South America | Asia | Oceania | Africa
DATA FORMATS
Tab delimited file (TXT) | KML | Access database (MDB) | Excel (xls) | Esri Shapefile (.shp) | Esri Geodatabase (.gdb) | MapInfo (.tab, .tabx) | MapInfo MIF/MID | GeoJSON | GeoParquet (.parquet) | GeoPackage (.gpkg) | more on request
> LEARN MORE
TELL US WHERE YOU ARE HEADING.
WE WILL GLADLY ASSIST YOU IN SELECTING THE DATA NEEDED TO REACH YOUR GOAL.
Didn’t find what you are looking for or have another question? Please do not hesitate to contact us!
Our experts will be happy to advise you individually and without obligation on which data you can use to create added value for your company and realize savings.
Would you like to evaluate and visualize the data?