CONSUMER SPENDING BY PRODUCT GROUPS
WHAT IS CONSUMER SPENDING BY PRODUCT GROUPS?
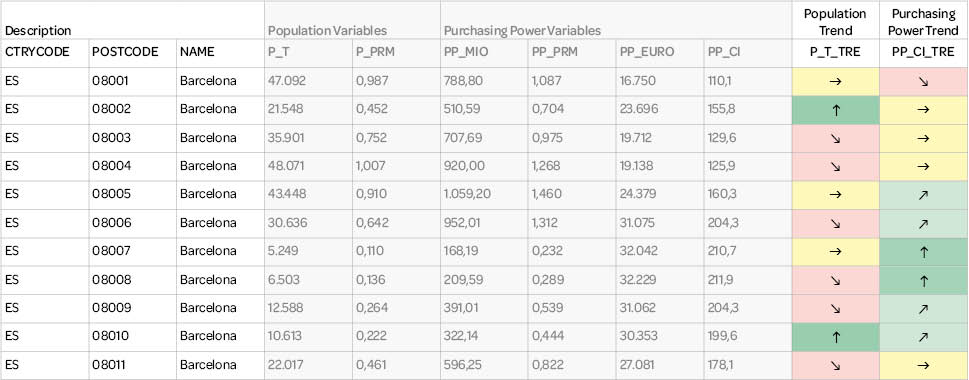
The general PURCHASING POWER describes the disposable income of households and is the most commonly used indicator for a region’s potential. The Purchasing Power however is not necessarily the most appropriate planning indicator for all providers of goods and services, as for a lot of products the consumers’ spending behavior does not exclusively relate to the disposable income. In order that you can improve your ability to respond to the specifics of your market, we enhanced our general Purchasing Power and calculated Consumer Spending for 20 product groups.
Consumer Spending data by product groups quantifies the expenditures of European consumers on certain groups of products. The ratio between disposable income, demographics, and expenditures for the products and services are derived from Household Budget surveys from the National Statistical Offices. By using such representative surveys and the regional and local statistics about income data and demographics, Consumer Spending data is calculated.
To determine market sizes, also household final consumption expenditure data by categories within the System of National Accounts is used. These data include estimates from the Statistical Offices for the ‘gray economy’. Consumer spending also includes estimates for consumption of own produced products and the purchase directly from the manufacturer.
Product Groups / Categories
- Food and non-alcoholic beverages
- Alcoholic beverages
- Tobacco
- Clothing
- Footwear
- Furniture and furnishings, carpets and other floor coverings
- Household textiles
- Household appliances
- Glassware, tableware and household utensils
- Tools and equipment for house and garden
- Routine household maintenance
- Medical products, appliances and equipment
- Consumer Electronics, photographic and IT equipment
- Durables for recreation and culture
- Toys and games, hobby, sport, garden, pets
- Recreational and cultural services
- Newspapers, books and stationery
- Catering Services
- Personal care
- Jewelry, clocks, watches and other personal effects
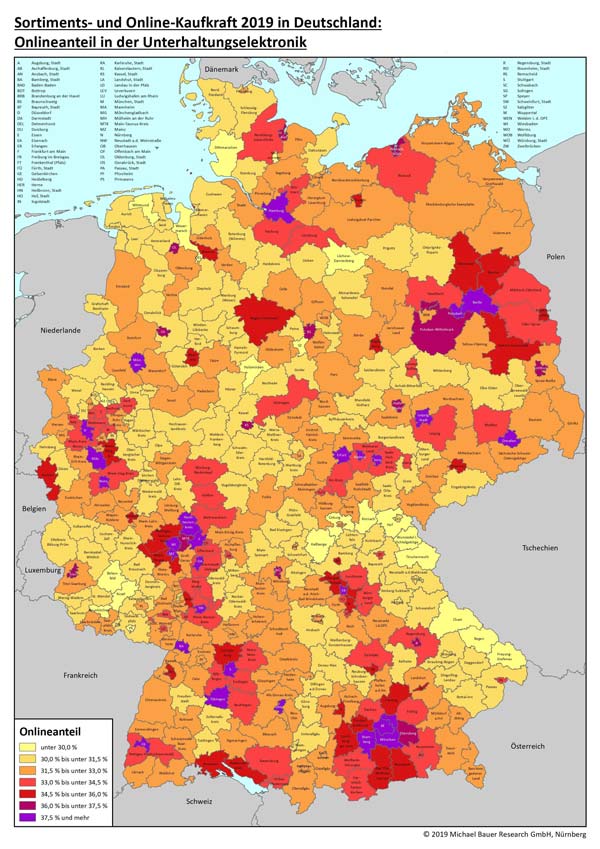
Further specifications and subdivisions are possible on request. Using our postcode, administrative or small area level boundaries for the geographic visualization of the Consumer Spending allows for an even more effective and efficient decision-making.
Add-on: MBI Trends
While numerous analyses can be conducted at a given point in time using Consumer Spending by Product Groups, MBI trends allow you to observe a period of time. They provide information on how Consumer Spending by Product Groups has changed compared to the last MBI data update.
License this add-on if you want to analyze developments and trends accurately.
KEY DIFFERENTIATORS

Globally consistent and comparable data

Strict quality control

Individual consulting and support

Continuous updating

100 % GDPR compliant
COUNTRY AVAILABILITY
Europe | North America | South America | Asia | Oceania | Africa
DATA FORMATS
Tab delimited file (TXT) | KML | Access database (MDB) | Excel (xls) | Esri Shapefile (.shp) | Esri Geodatabase (.gdb) | MapInfo (.tab) | MapInfo MIF/MID | more on request
> LEARN MORE
TELL US WHERE YOU ARE HEADING.
WE WILL GLADLY ASSIST YOU IN SELECTING THE DATA NEEDED TO REACH YOUR GOAL.
Didn’t find what you are looking for or have another question? Please do not hesitate to contact us!
Our experts will be happy to advise you individually and without obligation on which data you can use to create added value for your company and realize savings.
Would you like to evaluate and visualize the data?


