Unemployment Rate
Discover MBI’s Comprehensive Unemployment Rate Insights
The MBI Unemployment Rate data provides clear, reliable insights into regional labor markets, helping you make informed decisions. At Michael Bauer International, we are committed to delivering high-quality, globally consistent and comparable data that supports your business needs.
We source the data for our MBI Unemployment Rate from authoritative official channels, carefully structuring it across various geographic scales – administrative, micro, and postcode levels. This structured approach ensures seamless integration with existing systems, facilitating comprehensive regional analyses and planning.
In regions with extensive data availability, we apply sophisticated methods to model unemployment rates, capturing the nuanced dynamics of local economies. For areas with limited direct data, we allocate rates based on relevant regional patterns, ensuring a consistent and dependable view across different market segments.
Our data also includes forecasts that offer forward-looking insights, essential for strategic planning and long-term projections. With MBI’s Unemployment Rate data, you can confidently navigate regional labor markets, knowing you have the high-quality insights you need to drive your business forward.
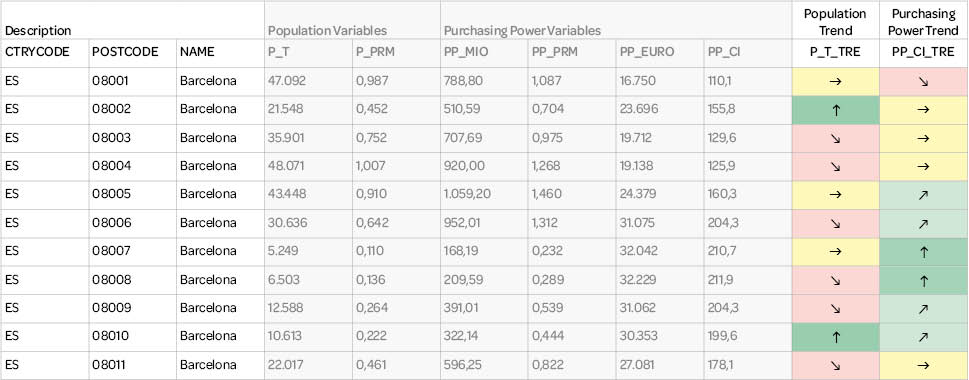
MBI’s unemployment rate data is presented in a well-structured, user-friendly format. MBI provides both current and forecasted unemployment rates in an Excel file, allowing businesses to easily integrate this data into their existing analytical tools and workflows. This flexibility enables efficient use of the data for deeper analysis, scenario planning, and internal reporting. By offering insights into both present and future labor market trends, businesses can make more precise and informed decisions based on clear and actionable regional market insights.
Key Differentiators

Globally consistent and comparable data

Strict quality control

Individual consulting and support

Continuous updating after every release

100 % GDPR compliant
COUNTRY AVAILABILITY
Europe | North America | South America | Asia | Oceania | Africa
DATA FORMATS
Tab delimited file (TXT) | KML | Access database (MDB) | Excel (xls) | Esri Shapefile (.shp) | Esri Geodatabase (.gdb) | MapInfo (.tab, .tabx) | MapInfo MIF/MID | GeoJSON | more on request
> LEARN MORE
TELL US WHERE YOU ARE HEADING.
WE WILL GLADLY ASSIST YOU IN SELECTING THE DATA NEEDED TO REACH YOUR GOAL.
Didn’t find what you are looking for or have another question? Please do not hesitate to contact us!
Our experts will be happy to advise you individually and without obligation on which data you can use to create added value for your company and realize savings.
Would you like to evaluate and visualize the data?


