
Purchasing Power Data Overview

Understanding Markets and Consumers Worldwide
What is Purchasing Power Data?
Purchasing power data represents regional consumption potential. It provides in-depth insights into disposable income, wealth, and consumption willingness of specific population groups, as well as consumer spending, broken down by product groups, distribution channels, and regions.
Both in retail and online sales, purchasing power data is crucial for targeted marketing strategies. Analyzing globally comparable purchasing power indicators enables sound decisions for market entry strategies and site planning.
MB-International, a provider of globally consistent and comparable market data, offers an extensive portfolio of purchasing power indicators and retail-relevant data from numerous countries worldwide, available for licensing.
Purchasing Power Indicators and Retail-relevant Data from MB-International
PURCHASING POWER (IN GENERAL)
Purchasing Power refers to the disposable income (net income excluding taxes and social security contributions, incl. transfer payments received) of a region’s population.
PURCHASING POWER TRENDS
MBI Purchasing Power Trends allows you to observe a period of time in order to be able to analyze changes, developments, and trends.
RETAIL SPENDING
Retail Spending comprises the shares of purchasing power available for retail spending.
RETAIL TURNOVER
Retail Turnover is the total of all sales made in the local retail trade.
RETAIL CENTRALITY
Retail Centrality is a measure of the attractiveness of a location as a shopping destination.
CONSUMER SPENDING
Consumer Spending quantifies the volume of spending by consumers in numerous countries on specific product ranges and services.
INCOME QUINTILES
Income quintiles provide information on the breakdown of household income at the national level into 5 classes.
CONSTRUCTION DATA
Our Construction Data shows the potential for all product groups related to the construction supply industry.
EXTRA DATA FOR GERMANY
Online Purchasing Power for Germany lists online spending for 39 product groups for all municipalities and 5-digit postal codes in Germany.
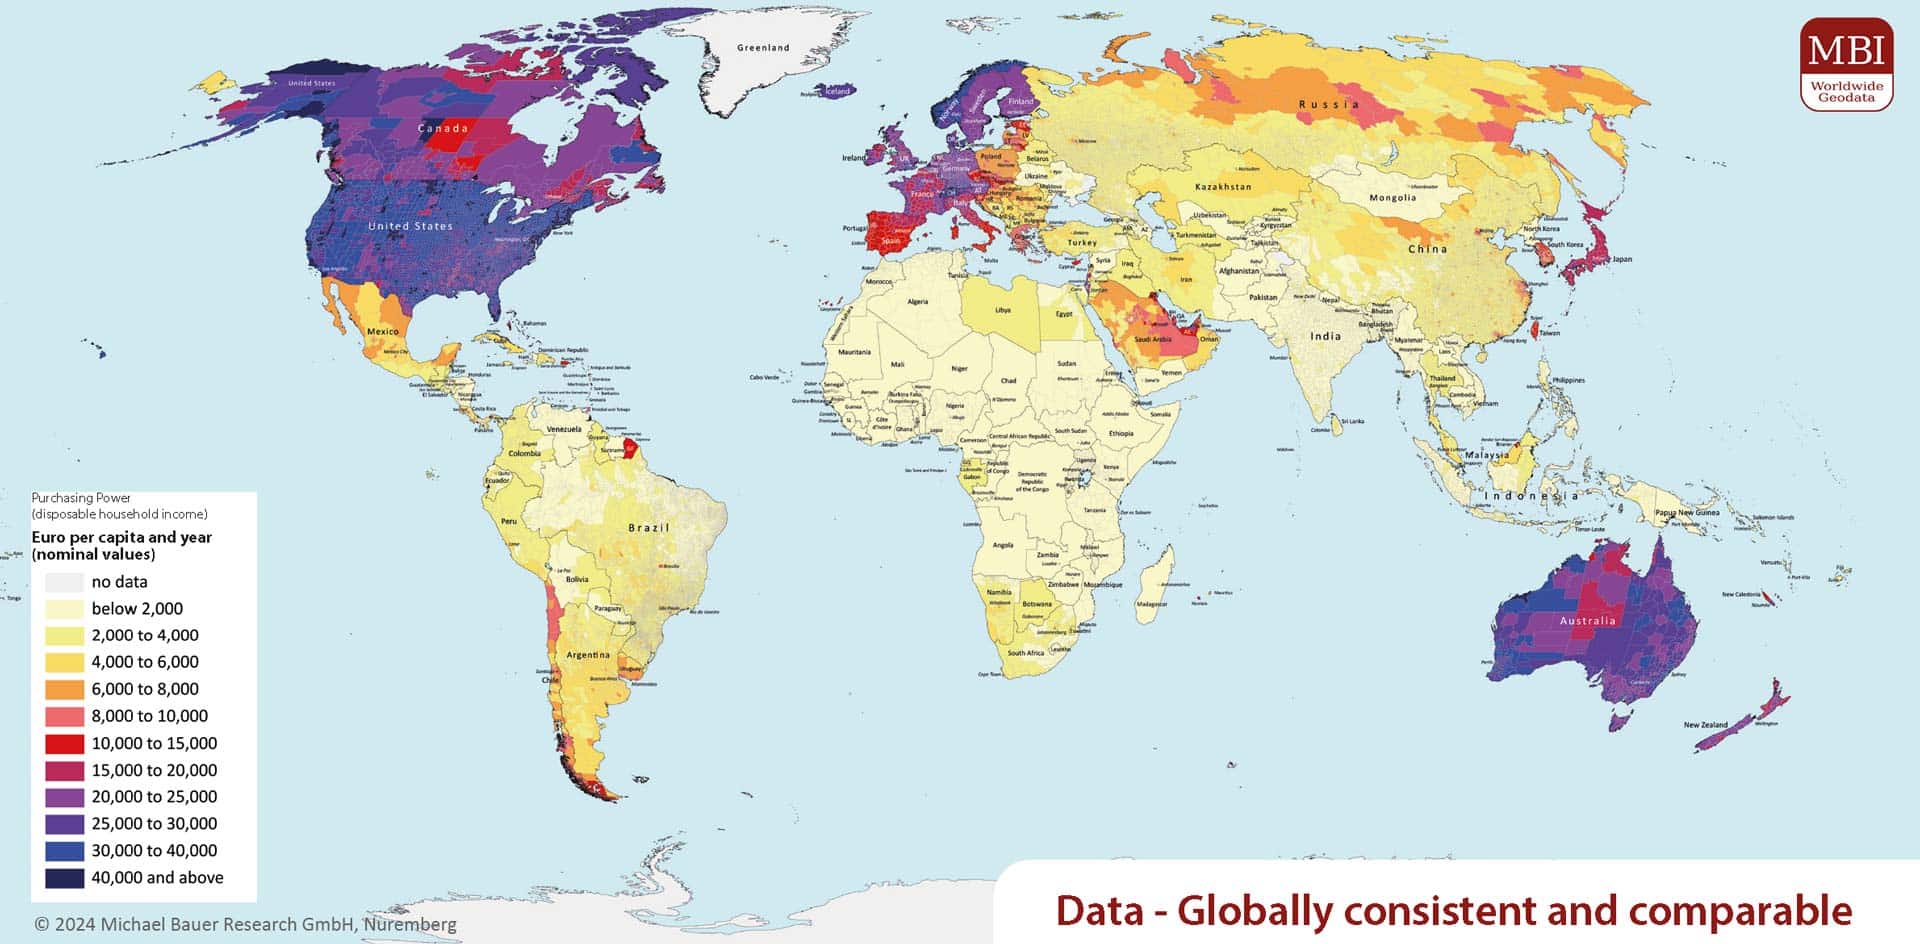
Map Purchasing Power Worldwide
Example map: annual nominal purchasing power per capita
Application: Purchasing Power Data for Your Market Analysis
What Use Cases is Purchasing Power Data Suitable For?
MBI’s purchasing power data is a reliable indicator for the distribution of products and services whose demand is strongly influenced by consumers’ income levels. In particular, the demand for premium products—whether sold directly or indirectly to consumers—is closely linked to purchasing power trends. As a result, purchasing power data is used by manufacturers of consumer and durable goods, retailers, banks, insurance companies, real estate firms, and consumer-oriented service providers to estimate sales potential. Determining purchasing power is also valuable for marketing more affordable products, as it helps identify areas with medium to low purchasing power.
Which Questions Can Be Answered with Purchasing Power Data?
- Market Analysis: What is the purchasing power of my current customers, and where are potential customers with similar purchasing power located?
- Pricing Strategy: How should a new product be priced?
- Advertising Planning: Where should advertising be placed to reach as many members of the target audience as possible?
- Product Assortment Planning: Which products should be included in the product range in a specific region?
- Branch Network Planning: Where should a new store be built to be accessible to as many members of the target audience as possible?
Key Differentiators

Globally consistent and comparable data

Strict quality control

Individual consulting and support

Continuous updating after every release

100 % GDPR compliant
What Methodology Underpins MBI’s Purchasing Power Data?
Experience and Quality for Over 25 Years
To enable both geographic and temporal comparisons, the data must be meticulously processed and normalized. At the same time, we monitor the ever-changing regional boundaries and socio-demographic conditions across the globe. This approach allows us to transform heterogeneous raw data into a reliable foundation for informed business decisions and detailed planning in localized geographic areas worldwide. Our long-standing experience as one of the leading global data providers, combined with rigorous quality controls, plays a crucial role in this process.

COUNTRY AVAILABILITY
Europe | North America | South America | Asia | Oceania | Africa
DATA FORMATS
Tab delimited file (TXT) | KML | Access database (MDB) | Excel (xls) | Esri Shapefile (.shp) | Esri Geodatabase (.gdb) | MapInfo (.tab, .tabx) | MapInfo MIF/MID | GeoJSON | GeoParquet (.parquet) | GeoPackage (.gpkg) | more on request
> LEARN MORE
TELL US WHERE YOU ARE HEADING.
WE WILL GLADLY ASSIST YOU IN SELECTING THE DATA NEEDED TO REACH YOUR GOAL.
Didn’t find what you are looking for or have another question? Please do not hesitate to contact us!
Our experts will be happy to advise you individually and without obligation on which data you can use to create added value for your company and realize savings.
Would you like to evaluate and visualize the data?
Discover More


MBI Geodata has released the latest update of its European Regional Market Data, delivering newly revised, …

In 2025, Europeans have an average purchasing power of €18,768 per capita. At 3.5%, per capita purchasing …

Germany’s purchasing power is on the rise again—projected to surpass €2,558 billion in 2025. On …

Karlsruhe, April 4th 2025: In 2024, Europe's economic landscape has undergone significant changes. The …

In today’s fast-paced global marketplace, making informed decisions requires access to the most up-to-date …

Karlsruhe, May 16th 2023: Michael Bauer International GmbH (MBI), a leading provider of geographic, …

Karlsruhe, February 09th 2023: When looking towards a more sustainable future, electric vehicles …

Karlsruhe, 19.01.2023: The fact that online retail has experienced a boost due to the Covid-19 pandemic …