« All posts
« All press releases
Press | Purchasing Power
Purchasing Power in Europe Rises to €13.6 Trillion in 2024
04/04/2025
Karlsruhe, April 4th 2025: In 2024, Europe’s economic landscape has undergone significant changes. The per capita purchasing power growth in Europe stands at 4.8%, equivalent to an increase of €784 per person. Further figures not only reveal intriguing regional disparities but also prompt a deeper investigation into the drivers behind these shifts. For example, Ireland has fallen out of the top 10. What has changed in 2024, and which countries are now setting new benchmarks in purchasing power?
Purchasing Power Across Europe and the EU
The total purchasing power across all European countries reached €13.6 trillion in 2024. When focusing solely on the European Union, the total purchasing power amounts to €9.4 trillion. This corresponds to an average per capita purchasing power of €20,978 within the EU and €17,228 across Europe.
Purchasing Power Map of Europe
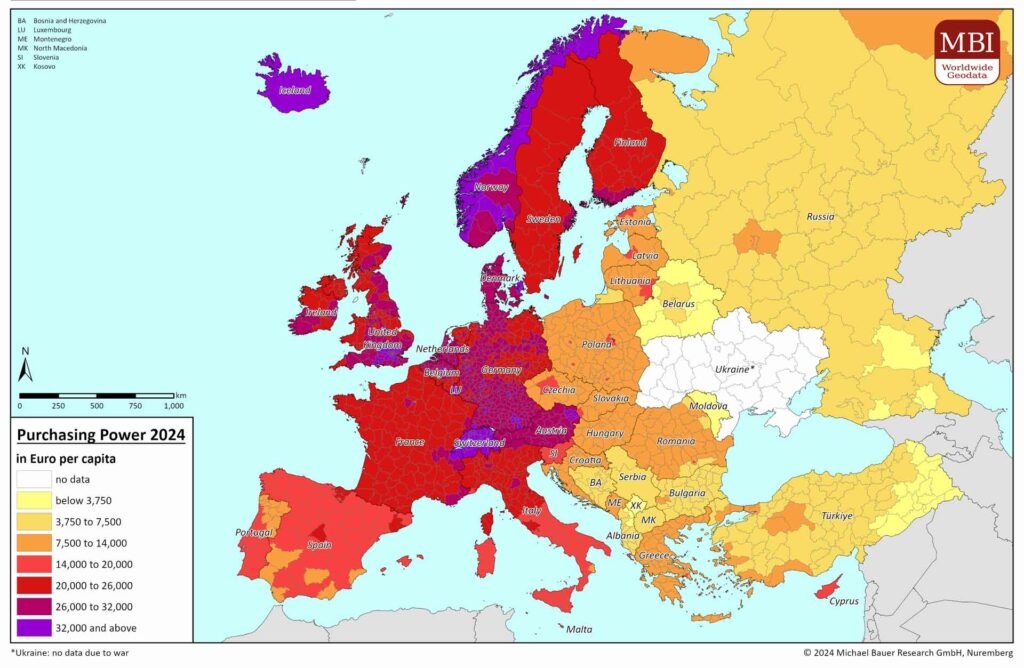
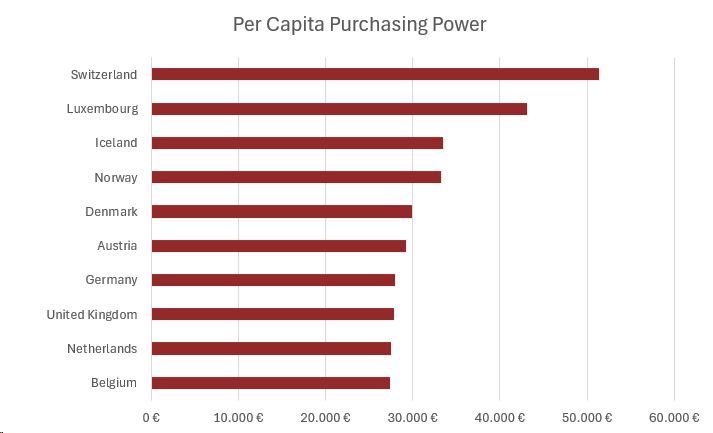
Purchasing Power Ranking: Top 10 in Europe
Purchasing power is not distributed evenly across the continent. Wealthier countries such as Switzerland and Luxembourg lead the ranking. Here are the Top 10 European countries by purchasing power index:
| Rank 2024 (vs. 2023) | Country | Population | Purchasing Power Index* |
| 1 (1) | Switzerland | 9,012,804 | 298 |
| 2 (2) | Luxembourg | 669,074 | 250 |
| 3 (3) | Iceland | 386,102 | 194 |
| 4 (4) | Norway | 5,520,950 | 193 |
| 5 (5) | Denmark | 5,974,340 | 174 |
| 6 (6) | Austria | 9,137,892 | 170 |
| 7 (7) | Germany | 84,762,574 | 162 |
| 8 (9) | United Kingdom | 67,846,317 | 162 |
| 9 (8) | Netherlands | 17,990,884 | 160 |
| 10 (11) | Belgium | 11,821,778 | 159 |
*Index per inhabitant; 100 = European average
Ireland, which ranked in the Top 10 in 2023, has been displaced due to a slower rate of purchasing power growth, allowing Belgium to advance in the ranking. Additionally, the United Kingdom now exhibits higher purchasing power than the Netherlands.
Top 3 Countries with the Strongest Purchasing Power Growth
Certain countries have experienced particularly rapid increases in their purchasing power index. The top three with the largest percentage increase in the purchasing power index compared to the previous year are:
| Country | Population | Purchasing Power Index* | Increase in Index |
| Turkey | 85,895,197 | 38 | 8 % |
| Moldova | 2,397,603 | 19 | 7 % |
| Poland | 37,603,980 | 66 | 7 % |
*Index per inhabitant; 100 = European average
The purchasing power level of these three countries was well below the European average in 2023. Purchasing power also remained below the average in 2024, although it increased more than in any other European country.
Comparison of European Purchasing Power
Despite positive developments in some nations, significant disparities in purchasing power remain across Europe. While Switzerland leads with an index of 298, countries like Moldova, Kosovo, Serbia, and Turkey fall well below the European average. Notably, the nine countries with the lowest per capita purchasing power are non-EU members.
Purchasing Power Data for 2025
The purchasing power data for 2024 serve as a critical foundation for economic forecasts, investment decisions, and salary negotiations in 2025. Companies can leverage these data to target investments in regions experiencing significant growth, while policymakers can design targeted interventions to boost purchasing power in underperforming areas.
MBI Market Data
Typically, purchasing power metrics are available as forecast values for the current year. At MBI, we provide an additional update at the start of each year. This process involves recording all past values, comparing various sources and carefully checking the results. MBI is pleased to announce that the updated 2024 purchasing power data are now available. These thoroughly researched figures offer a reliable basis for your forecasts and strategic decisions in 2025. The major advantage of our data is their global consistency and comparability, enabling cross-country analyses. View the Europe Purchasing Power Overview.
The development of purchasing power in Europe in 2025 is contingent on a number of economic and political factors, including inflation, exchange rates, wage trends and economic stability. These developments will also be pivotal in determining the trajectory of purchasing power in the coming years.
Further Purchasing Power Products
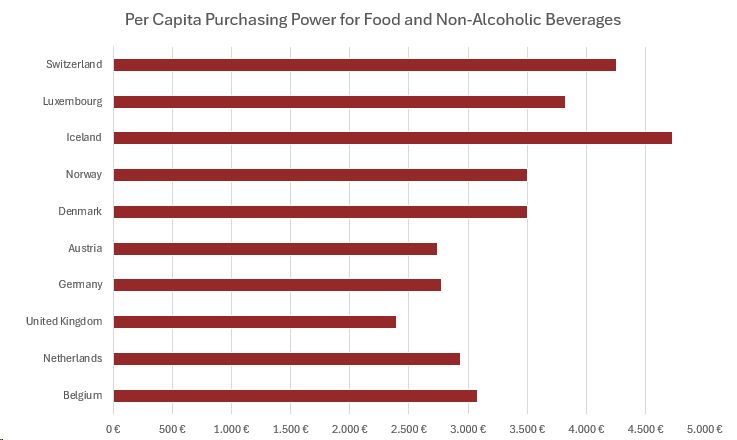
Depending on your industry and project needs, it may be advantageous to explore more specific purchasing power metrics — such as per capita purchasing power for food and non-alcoholic beverages — tailored to support your detailed geospatial analyses. This metric can serve as a crucial foundation for sales forecasts by food manufacturers, among other applications.
As can be seen in the chart for the 10 countries with the highest purchasing power in Europe, the purchasing power for a specific product group is not necessarily highest where the general purchasing power is highest.
*Europe: This Europe total data set includes the 41 most important countries, excluding Ukraine (no data for 2024 due to war)