Purchasing Power
What is Purchasing Power / Disposable Income Data?
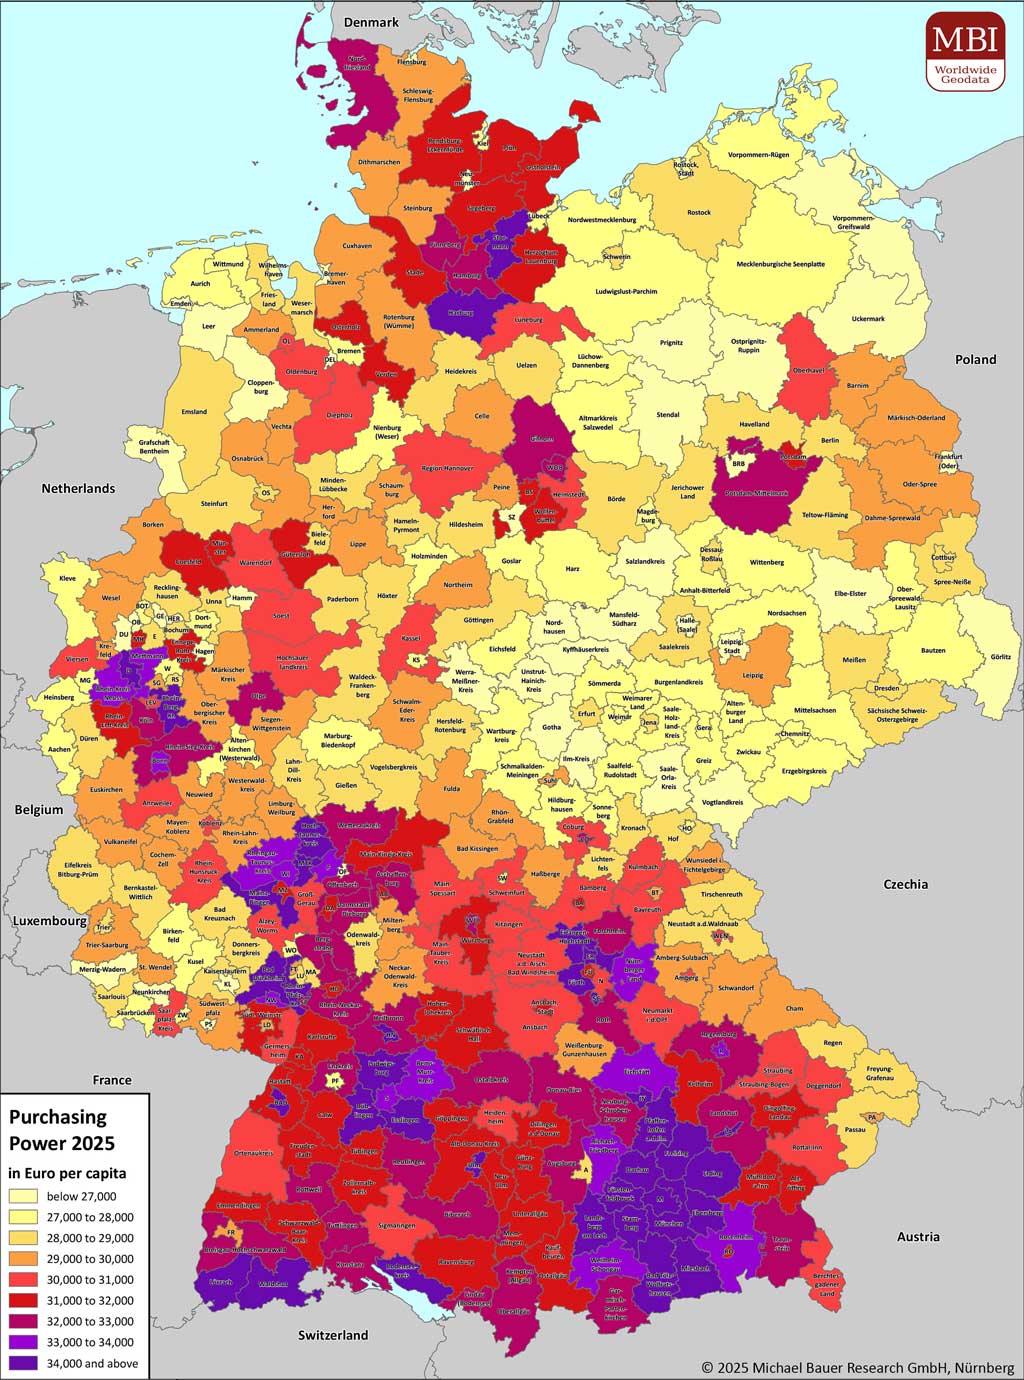
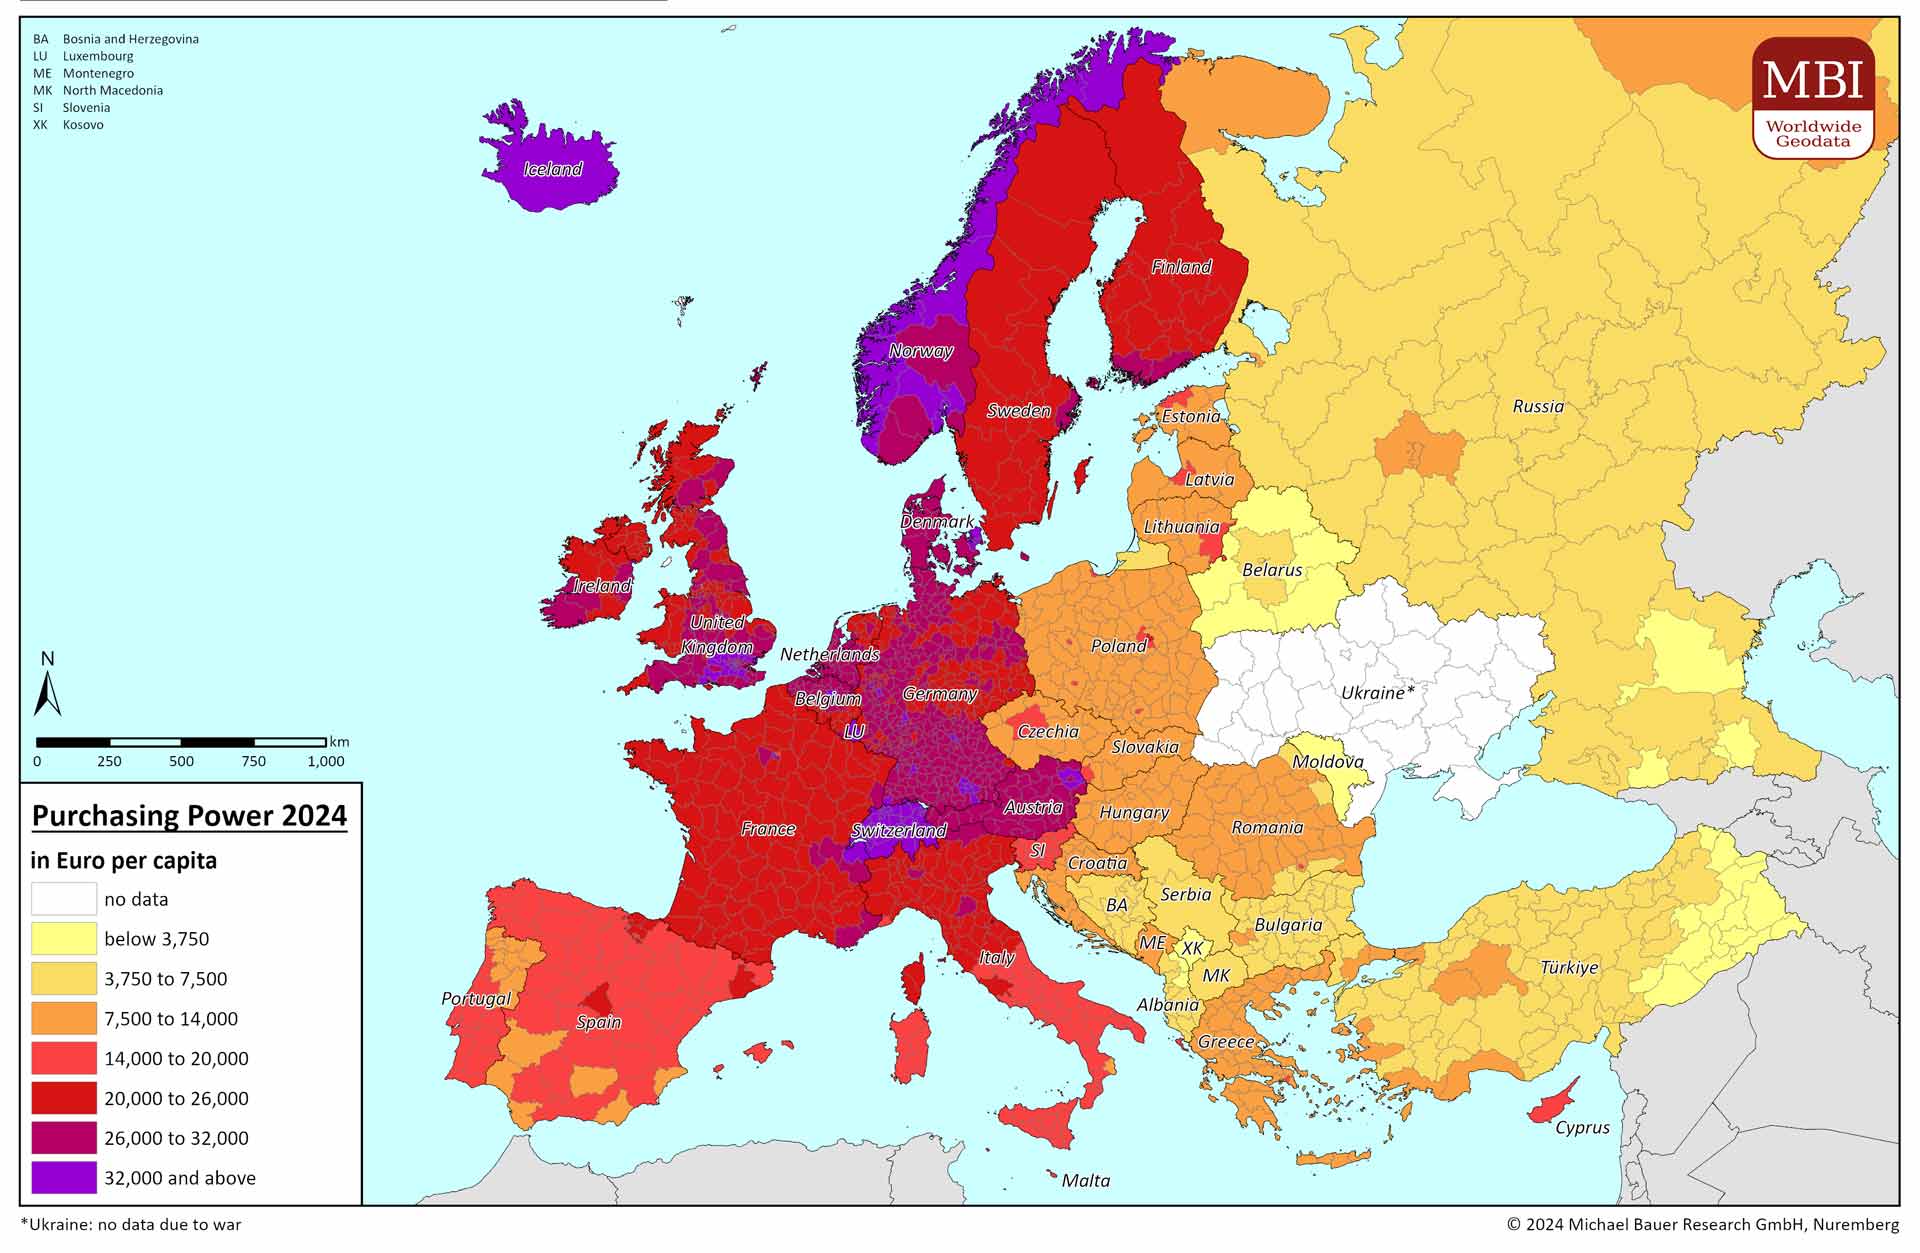
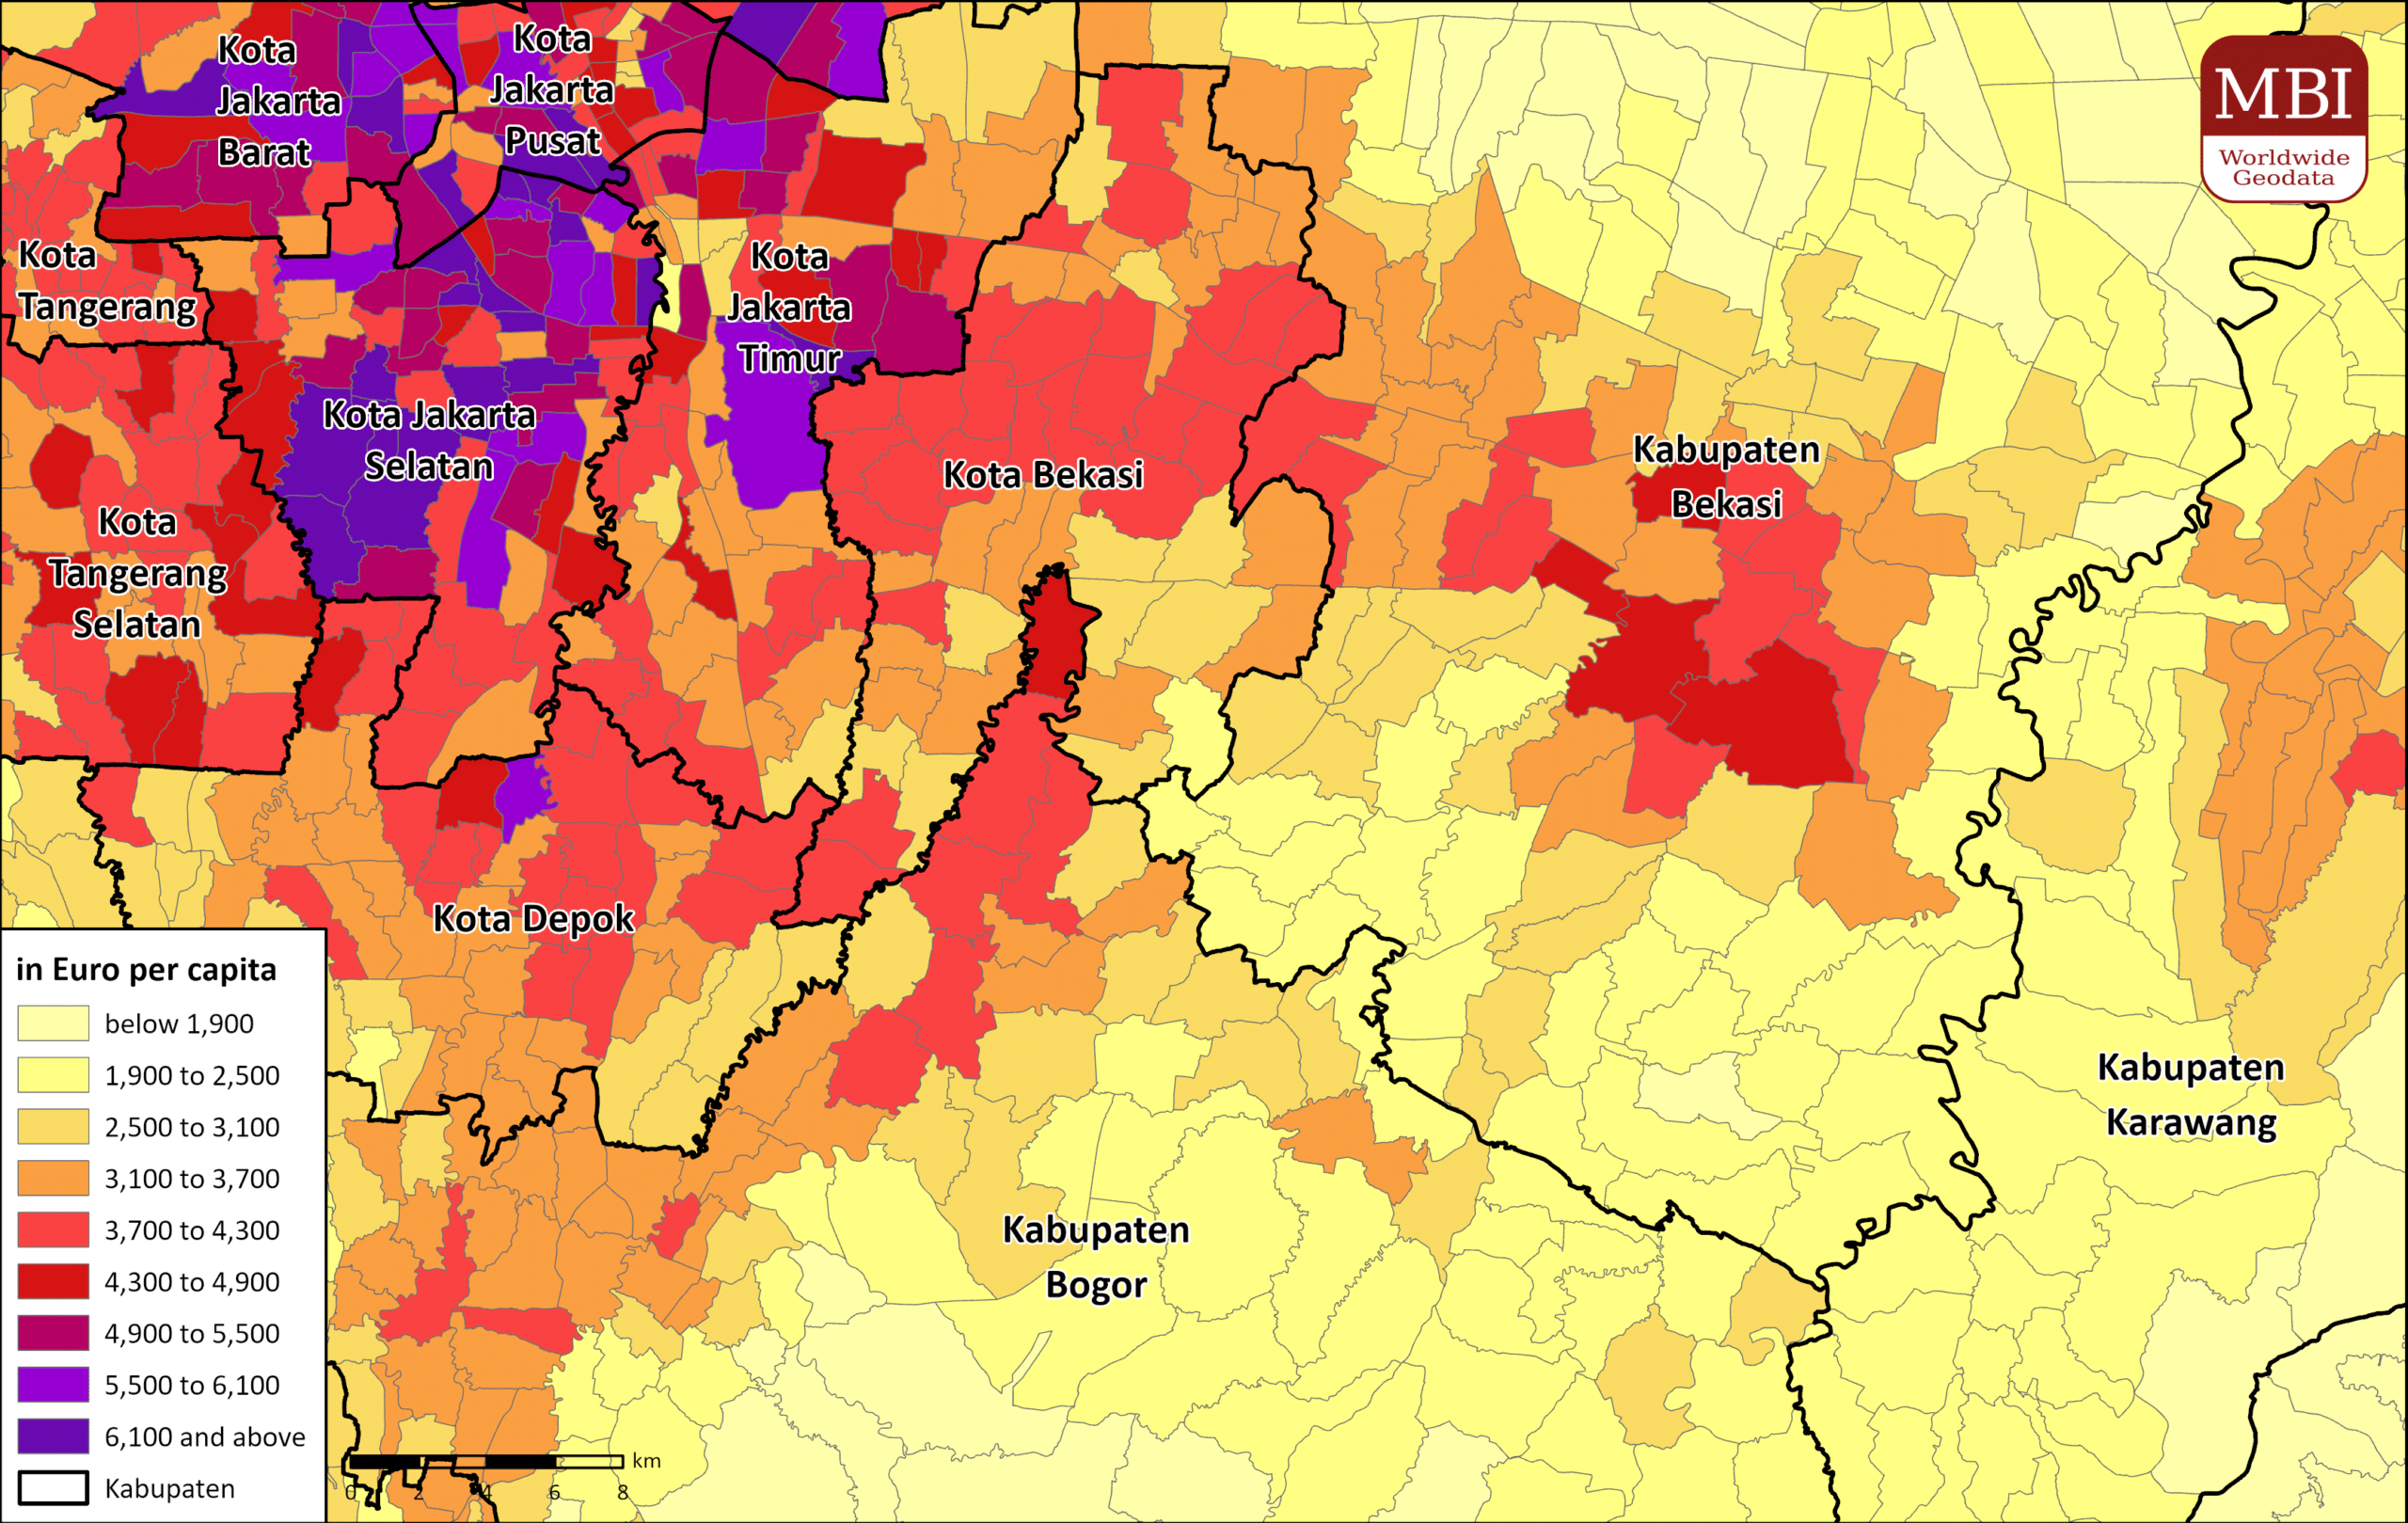
Purchasing Power refers to the disposable income (i.e., income after taxes and social contributions, including received transfer payments) of a certain region’s population. Consequently, Purchasing Power consists of net incomes from employment and assets (after taxes and social contributions), pensions, unemployment benefits, benefit payments and other national transfer payments.
The Purchasing Power Index is a key metric that relates buying power to a reference value. It indicates how high the purchasing power in a specific region is compared to another region or the national average, allowing for easy comparability.
Purchasing Power – The Key Indicator for Consumption Potential
For consumer goods manufacturers, retailers, and service providers engaged in regional sales planning, demand forecasting, location analysis, and geomarketing, purchasing power is the most commonly used indicator of a region’s consumption potential.
Buying Power Indicators: Absolute, Relative, Per Capita, or Index
What’s Included in MBI’s Data Offering?
- Two digit country code by ISO 3166
- Administrative code / Postal code / Micro-code: A code for the unique identification of a region, e.g., a municipal code
- Name of administrative area / Name of the most populous administrative area / Name of the respective micro-area or the next higher level
- Population (Nighttime) year average: total number (For example, how many people live in a specific municipality?)
- Population (Nighttime) year average: per mill of country (e.g., what percentage of the country’s population lives in a specific municipality?).
- Purchasing Power: in million Euros per region (absolute values)
- Purchasing Power: per mill of country (relative value comparing the region’s purchasing power to the entire country)
- Purchasing Power: Euro per capita. Purchasing power per inhabitant (the average disposable income per person in the region)
- Purchasing Power: index (country eq. 100). Per capita index: An index of 100 indicates that the purchasing power in the area matches the national average. An index above or below this average shows the extent of deviation, either positive or negative.
The spending power data can be licensed for various geographic levels: administrative areas (e.g., municipalities), postal code areas (ZIP), and micro areas.
Add-on:
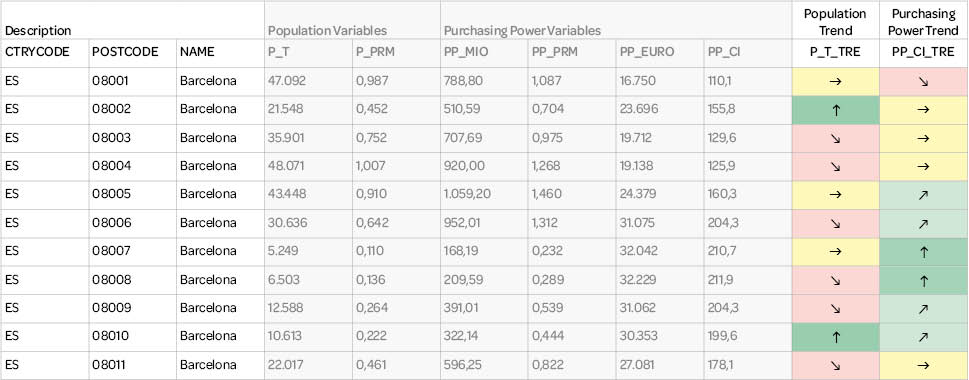
Purchasing Power Trends
While numerous analyses can be conducted at a given point in time using Purchasing Power Data, MBI Purchasing Power Trends allow you to observe a period of time. They provide information on how Purchasing Power has changed compared to the last MBI data update.
License this add-on if you want to analyze developments and trends accurately.
Example Purchasing Power
Income Data on municipality level for the Czech Republic
| Admincode | Name | Population | Purchasing Power | ||||
|---|---|---|---|---|---|---|---|
| Municipality/Obce | year average | per mill of country | in million Euros | per mill of country | Euro per capita | Index country = 100 | |
| 500496 | Blevice | 285 | 0.027 | 1.89 | 0.025 | 6,624 | 92.7 |
| 505188 | Buštěhrad | 2,791 | 0.265 | 20.51 | 0.273 | 7,350 | 102.9 |
| 505587 | Dřetovice | 500 | 0.048 | 3.07 | 0.041 | 6,137 | 85.9 |
| 505927 | Koleč | 623 | 0.059 | 3.84 | 0.051 | 6,156 | 86.2 |
| 507016 | Otvovice | 674 | 0.064 | 4.31 | 0.057 | 6,397 | 89.5 |
| 511382 | Slatina | 444 | 0.042 | 2.98 | 0.040 | 6,710 | 93.9 |
| 513750 | Stehelčeves | 723 | 0.069 | 4.93 | 0.066 | 6,816 | 95.4 |
| 523704 | Třebusice | 510 | 0.048 | 3.47 | 0.046 | 6,809 | 95.3 |
| 529303 | Zákolany | 541 | 0.051 | 3.48 | 0.046 | 6,429 | 90.0 |
| 530883 | Kralupy nad Vltavou | 17,726 | 1.685 | 136.62 | 1.818 | 7,707 | 107.9 |
| … | |||||||
| Czech Republic | 10,518,570 | 1,000.000 | 74,892.62 | 1,000.000 | 7,120 | 100.0 | |

Use Case: Expansion Planning with Disposable Income Data
A fashion retailer is planning to gradually expand into the Spanish market. Since the company has no prior market experience in Spain and would like to assess the potential for success there first, the expansion is set to begin with a limited number of locations. To make an informed decision about the first test store, the company initially analyzes the buying power distribution across Spain for a broad overview. Regions with high disposable income are shortlisted, as higher wealth in these areas suggests greater demand for the retailer’s premium fashion products.
In the next step, the company conducts a more detailed analysis of consumer spending by product groups and retail turnover at the postal code level. This helps to better understand where and on what goods consumers are spending their money. Ultimately, the company identifies a highly suitable location and successfully launches its expansion into the Spanish market.
How Can Your Business Benefit from Purchasing Power Data Overall?
With our precise buying power data, you can better understand your customers, optimize your market strategy, and make informed decisions that boost efficiency and revenue. Tailor your offerings to the specific needs of your target audience and stay one step ahead of the competition.
Key Differentiators

Globally consistent and comparable data

Strict quality control

Individual consulting and support

Continuous updating after every release

100 % GDPR compliant
COUNTRY AVAILABILITY
Europe | North America | South America | Asia | Oceania | Africa
DATA FORMATS
Tab delimited file (TXT) | KML | Access database (MDB) | Excel (xls) | Esri Shapefile (.shp) | Esri Geodatabase (.gdb) | MapInfo (.tab, .tabx) | MapInfo MIF/MID | GeoJSON | GeoParquet (.parquet) | GeoPackage (.gpkg) | more on request
> LEARN MORE
TELL US WHERE YOU ARE HEADING.
WE WILL GLADLY ASSIST YOU IN SELECTING THE DATA NEEDED TO REACH YOUR GOAL.
Didn’t find what you are looking for or have another question? Please do not hesitate to contact us!
Our experts will be happy to advise you individually and without obligation on which data you can use to create added value for your company and realize savings.
Would you like to evaluate and visualize the data?

