
Global Daytime Population Density
WHAT IS GLOBAL DAYTIME POPULATION DENSITY?
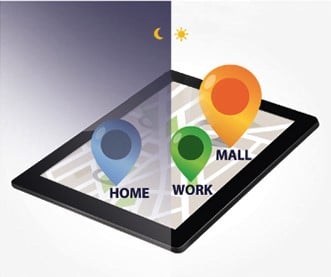
Global Daytime Population Density gives information about the size of population that is present in a given area during the day.
The population within an area is defined by official statistics as the number of residents being registered in that area. This refers to nighttime population, consisting of permanent residents. On the other hand, there is the daytime population, consisting of the number of people who are present in an area during the day. It includes, among others, consumers, tourists, workers, and residents. Yet there are two different types of populations for any given area.
This is an important difference, especially for organizations that want to find out where people are during the day, rather than where they live. Despite official statistics, many parts of the world have populations that vary wildly from day to night. The daytime population in most areas increase substantially during the day, particularly those that have a workforce coming into the area for work and then commuting elsewhere at the end of the day.
METHODOLOGY
Calculated by using a multitude of variables:
- Total current resident population of a given area
- The number of workplaces, secondary home, POIs and other regular locations
- Internal migration based on the change of the residences within an area
- Cross-border migration, based on the regular travels between different countries
- Accessing temporary population statistics
- Assessing temporary population (hourly, daily, weekly, monthly, etc.)
SMART COMBINATION
Connecting the daytime population data with our globally consistent and comparable geodata you can identify valuable correlations. Additional to the information about how many people are located in a certain place at a certain time, you can also find out which target group they belong to. This provides you with the best basis for well-founded and data-based decisions.
KEY DIFFERENTIATORS

Globally consistent and comparable data

Strict quality control

Individual consulting and support

Continuous updating

100 % GDPR compliant
COUNTRY AVAILABILITY
Europe | North America | South America | Asia | Oceania | Africa
DATA FORMATS
Tab delimited file (TXT) | KML | Access database (MDB) | Excel (xls) | Esri Shapefile (.shp) | Esri Geodatabase (.gdb) | MapInfo (.tab, .tabx) | MapInfo MIF/MID | GeoJSON | more on request
> LEARN MORE
TELL US WHERE YOU ARE HEADING.
WE WILL GLADLY ASSIST YOU IN SELECTING THE DATA NEEDED TO REACH YOUR GOAL.
Didn’t find what you are looking for or have another question? Please do not hesitate to contact us!
Our experts will be happy to advise you individually and without obligation on which data you can use to create added value for your company and realize savings.
Would you like to evaluate and visualize the data?
Discover More


When making strategic business decisions, retailers can rely on location intelligence to gain valuable …

The most important factor in the real estate business is location. The value of a property highly depends …

CATCHMENT AREA ANALYSIS – CUSTOMER ANALYSIS- COMPETITION ANALYSIS- CUSTOMER JOURNEY
The data on Retail …