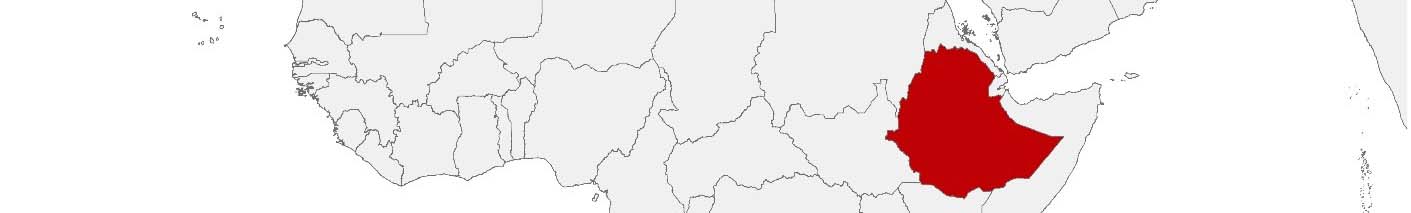
Ethiopia Purchasing Power, Socio-demographics & Area Boundaries

Your trusted Source of Geodata for Ethiopia for Zones
Discover a comprehensive suite of geodata for Ethiopia from our extensive global data offering of sociodemographic and purchasing power data. Elevate your geomarketing, target group analyses, and location studies with our detailed insights. MBI provides accurate area boundaries (vector boundaries, polygons) with detailed, seamless coverage of the following areas: Zones. Our data’s global consistency and comparability enable you to draw comparisons between Ethiopia and any other country worldwide. Additionally, political risk data allows you to develop targeted adaptation strategies to increase your location, logistics, and investment security.
Tailored for professionals in areas such as expansion planning, risk management, portfolio analysis, and statistical research, our data is accessible in all standard GIS formats and Excel. Licensed from MBI, this data ensures you have the robust information needed for strategic decision-making to drive your sales and business forward and maximize ROI.
Data that can currently be licensed from mbi for Ethiopia
Each attribute or geographical level can be licensed individually.
| Geographic level | ||
|---|---|---|
| Area level | Administrative | Grid |
| Name | Zones | 100 x 100 m |
| Number of areas | 85 | |
| Geometry | ||
| Polygons | ||
| Data / Variables | ||
| Population | ||
| Political Risk | ||
| Get a quote | Get a quote | |
| Additional Political Risk Data by Regions | ||||
|---|---|---|---|---|
| Regions | SUSAFE Basic | Calculated Trends | Conflict Insights | |
| Self-Explaining Political Risk Data | 11 | |||
| Get a quote | Get a quote | Get a quote | Get a quote | |
Geodata for Ethiopia: Empowering Development with Analytics
Ethiopia, a country of ancient civilizations, diverse cultures, and significant economic potential, faces unique challenges and opportunities in development. Its vast landscapes, ranging from the rugged highlands to the arid deserts, necessitate the use of geodata to address issues related to agriculture, urbanization, and resource management. MBI’s offerings for Ethiopia are designed to support these needs, providing insights for GIS, spatial analysis, transportation planning, and risk management.
Geographical Levels and Products
MBI’s geodata for Ethiopia is concentrated at the “Zones” level for analysis of the country’s varied geographic and demographic landscape. The available products for these areas include:
- Population Data: For understanding demographic patterns and targeting development initiatives.
- Digital Boundaries: For detailed mapping and spatial analysis, supporting infrastructure development, environmental conservation, and strategic planning.
These offerings meet the demands of a wide range of sectors, from agriculture and health to urban planning and environmental management, facilitating informed decision-making and strategic planning.
Country-Specific Insights
Ethiopia’s ambitious development goals, including enhancing agricultural productivity, improving public health, and fostering urban development, can greatly benefit from precise and detailed geodata. For instance, population data can help in optimizing healthcare delivery and designing targeted education programs, while digital boundaries are invaluable for agricultural zoning, water resource management, and urban planning. Moreover, Ethiopia’s focus on sustainable development and climate resilience underscores the importance of leveraging geodata for environmental monitoring and conservation efforts.
Why Use Geodata from MBI for Ethiopia
By offering useful insights at the “Zones” level, MBI enables a broad spectrum of stakeholders to implement effective strategies that promote sustainable growth, enhance public services, and improve the quality of life for Ethiopians.
Advantages of our administrative Boundaries
- Worldwide, seamless coverage of postal and administrative boundaries
- The layers are topographically correct and country borders fit seamlessly together without overlaps and gaps
- Data and areas can be easily combined in one layer thanks to a unique key, enabling cross-country analysis
- Constant updates guarantee a current data status
- The vintage compatibility between the MBI boundaries and the MBI Sociodemographic and Purchasing Power data is guaranteed
- Simple update by uniform layout of the layer names
- The higher-level area hierarchies are included with the boundary files
- Digital boundaries are in a vector format to allow visualization in any zoom levels
Smart Combination
The territorial vintages of the worldwide area boundaries are compatible with our globally consistent and comparable socio-economic data. We offer you a reliable basis for well-founded and data-based decisions. If desired, we can integrate the MBI data directly into our digital boundaries. So, you can load them directly into your system without any additional steps and use them immediately.
COUNTRY AVAILABILITY
Europe | North America | South America | Asia | Oceania | Africa
DATA FORMATS
Tab delimited file (TXT) | KML | Access database (MDB) | Excel (xls) | Esri Shapefile (.shp) | Esri Geodatabase (.gdb) | MapInfo (.tab, .tabx) | MapInfo MIF/MID | GeoJSON | GeoParquet (.parquet) | GeoPackage (.gpkg) | more on request
> LEARN MORE
TELL US WHERE YOU ARE HEADING.
WE WILL GLADLY ASSIST YOU IN SELECTING THE DATA NEEDED TO REACH YOUR GOAL.
Didn’t find what you are looking for or have another question? Please do not hesitate to contact us!
Our experts will be happy to advise you individually and without obligation on which data you can use to create added value for your company and realize savings.
Would you like to evaluate and visualize the data?