Boundaries | News | Purchasing Power
Purchasing Power Data at Grid Level: More Precision for Location Intelligence
09/15/2026
Where exactly is market potential concentrated within a city or region? Administrative, postal and micro geographies provide a strong foundation for market analysis by reflecting meaningful geographic structures and boundaries. For certain location-based decisions, however, an additional level of granularity within these areas can provide valuable insights.
MBI Purchasing Power Data is now available for 100 × 100 m grids, aggregated grid resolutions and H3 hexagonal grids, in addition to established postal, administrative and micro geographies. This enables highly granular analysis of local market potential while providing a consistent geographic framework for comparisons across regions and international markets.
From retail site selection and catchment area analysis to network planning and market expansion, grid-based Purchasing Power Data gives organizations greater flexibility to analyze market potential exactly where it matters.
Adding Granularity to Geographic Analysis
Purchasing Power describes the disposable income available to the population for consumption purposes. Traditionally, this information is provided for geographic areas such as municipalities, postal codes or other administrative units.
Grid-based Purchasing Power Data adds another layer of detail to these established geographic levels. Purchasing power is allocated to standardized spatial cells, enabling organizations to analyze variations within postal, administrative and micro geographies at a significantly more granular level.
MBI Purchasing Power Data is available at different grid resolutions:
- 100 × 100 m for highly detailed local analysis
- 200 × 200 m
- 500 × 500 m
- 1 × 1 km
- H3 hexagonal grids at different resolutions
Organizations can therefore choose the geographic level that best fits their specific use case and analytical requirements.
Why Use Grids and Hexagons for Purchasing Power Analysis?
Greater granularity: Market potential can vary considerably within a municipality, postal code or even a neighborhood. Grid-level data makes these local differences visible and provides a more detailed picture of how purchasing power is distributed across an area.
More flexibility: Established boundaries reflect meaningful geographic structures and can account for natural or infrastructural barriers that influence how areas are connected. Grid data complements these geographic levels where additional detail is needed, allowing individual cells to be analyzed or combined for specific use cases such as store catchments, drive-time zones or sales territories.
Consistent spatial analysis: Standardized grids provide a common geographic framework that can be applied across different regions and countries. Combined with MBI’s globally consistent and comparable data, this enables organizations to analyze market potential across international markets using a consistent methodology. Purchasing Power Data can be enriched with MBI’s extensive portfolio of demographic and market data and integrated with additional geospatial information such as points of interest, infrastructure, store networks or mobility data.
H3 hexagons offer an additional option for organizations working with modern geospatial analytics. The hierarchical spatial indexing system supports efficient aggregation across different resolutions and can provide a consistent framework for integrating multiple spatial datasets.
Purchasing Power at Hexagon-Grid Level: Madrid
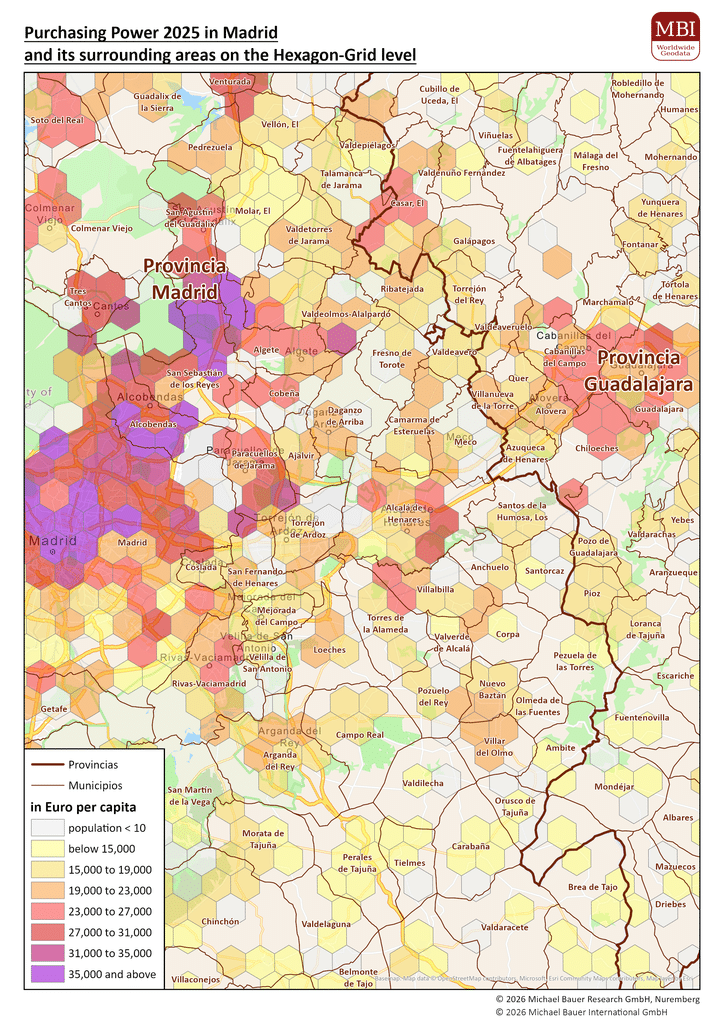
The map above illustrates MBI Purchasing Power 2025 for Madrid and its surrounding areas at hexagon-grid level.
The visualization shows how purchasing power is distributed across the metropolitan area in standardized hexagonal cells. Local clusters and differences in market potential become visible at a level that would be difficult to identify when looking only at larger geographic units.
This level of detail can provide valuable additional insight when comparing potential locations, examining the market surrounding an existing site or defining individual catchment areas.
From Site Selection to Market Expansion
Highly granular Purchasing Power Data can support a wide range of location intelligence applications.
For retail site selection and network planning, grid-level data provides additional insight into how population and purchasing power are distributed within a defined market area. This can help organizations assess the potential surrounding individual locations, compare prospective sites and better understand overlaps between catchment areas and potential cannibalization effects within an existing store network.
For network planning, grid-level data can reveal areas with attractive market potential that may currently be underserved by an existing store, branch or service network.
In sales territory planning, individual grid cells can be aggregated into custom territories to evaluate and compare their market potential.
And when entering new cities, regions or international markets, standardized grid structures make it easier to apply a consistent analytical approach across different geographic environments.
The Right Geographic Level for Every Analysis
There is no single geographic level that is ideal for every location intelligence use case. Postal, administrative and micro geographies remain the preferred foundation for many analyses, as their boundaries reflect meaningful geographic structures. Grid-based data complements these established levels by providing additional spatial precision where a more granular view within an area is required.
By adding grid and H3 hexagon delivery to its established geographic levels, MBI provides organizations with even greater flexibility in how they integrate and analyze its globally consistent and comparable Purchasing Power Data.
Interested in Purchasing Power Data at grid or hexagon level? Contact us to learn more about available countries, grid resolutions and data formats.