Political Conflict Dashboard
Analysis and visualization platform based on MBI CONIAS Conflict Data for the strategic management of Political Risks in your organization
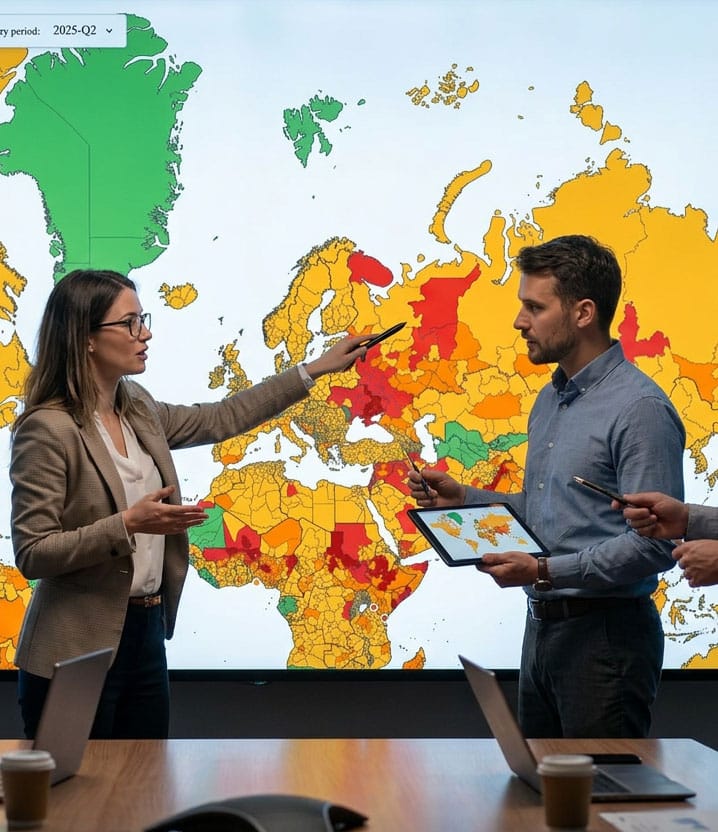
See where political risk is rising before it hits your business
Amidst rising geopolitical tensions, there is an increasing demand for organizations to systematically monitor political risks and incorporate them into strategic decision-making processes.
Track conflict intensity at regional level, updated quarterly, built for real-world decisions in risk, insurance, and global operations.
Individual events or headlines often provide only limited guidance. A reliable assessment of political risks requires analyzing conflict dynamics over longer periods of time.
The globally consistent and comparable MBI CONIAS conflict data allows political conflict dynamics to be analyzed systematically by capturing escalation patterns over long time periods and making them comparable across regions.
The goal is not the real-time representation of individual events but the structured monitoring of conflict developments over time.
The Political Conflict Dashboard allows users to interactively explore CONIAS conflict data, analyze conflict developments over time, and track regional conflict dynamics down to the subnational level.
Key features of the political Conflict Dashboard
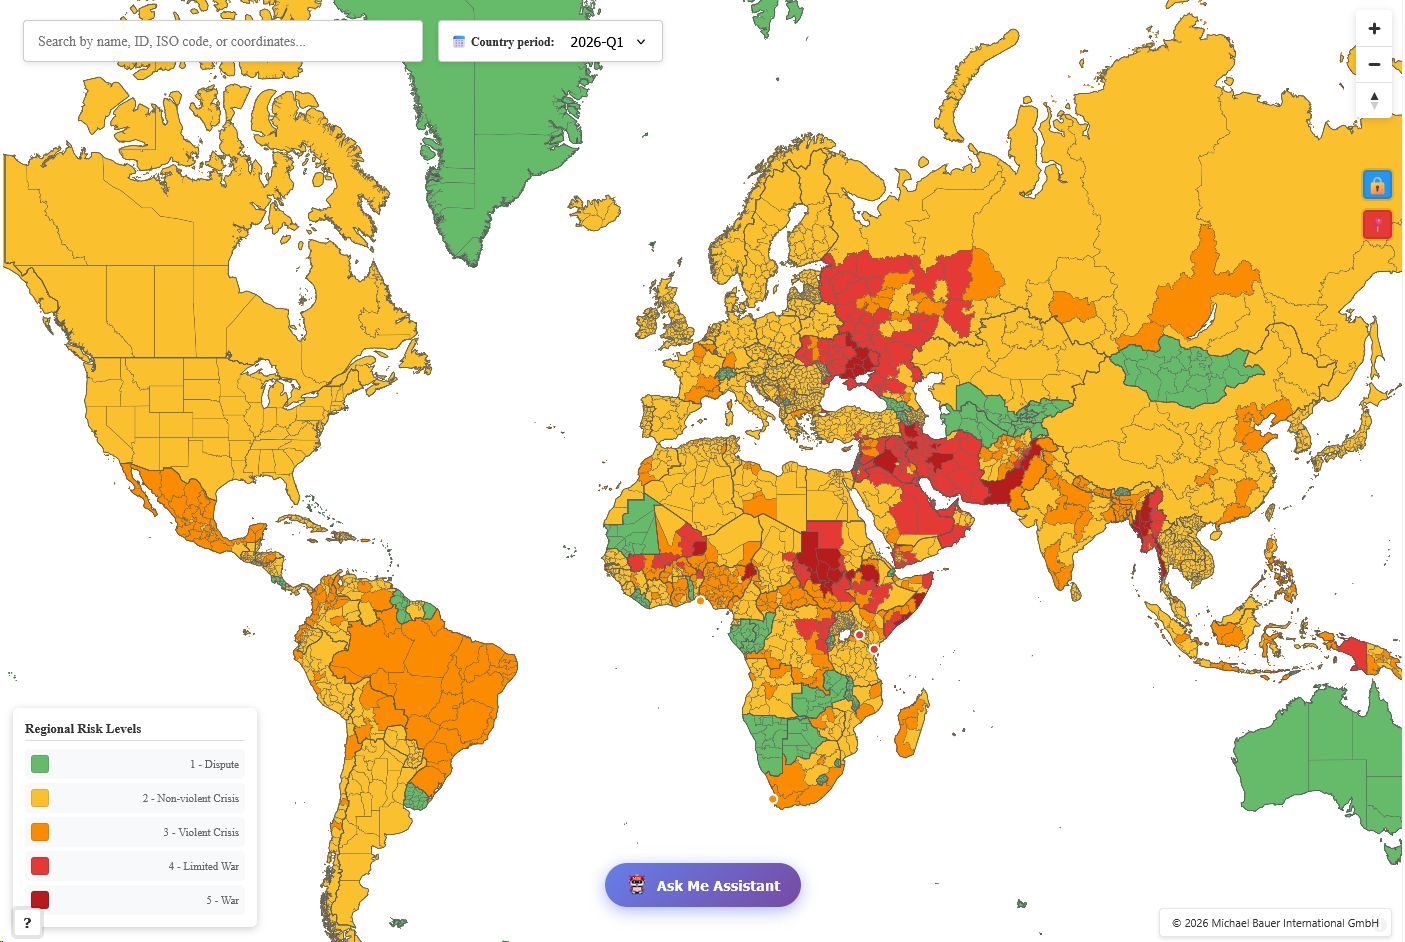
Global conflict map
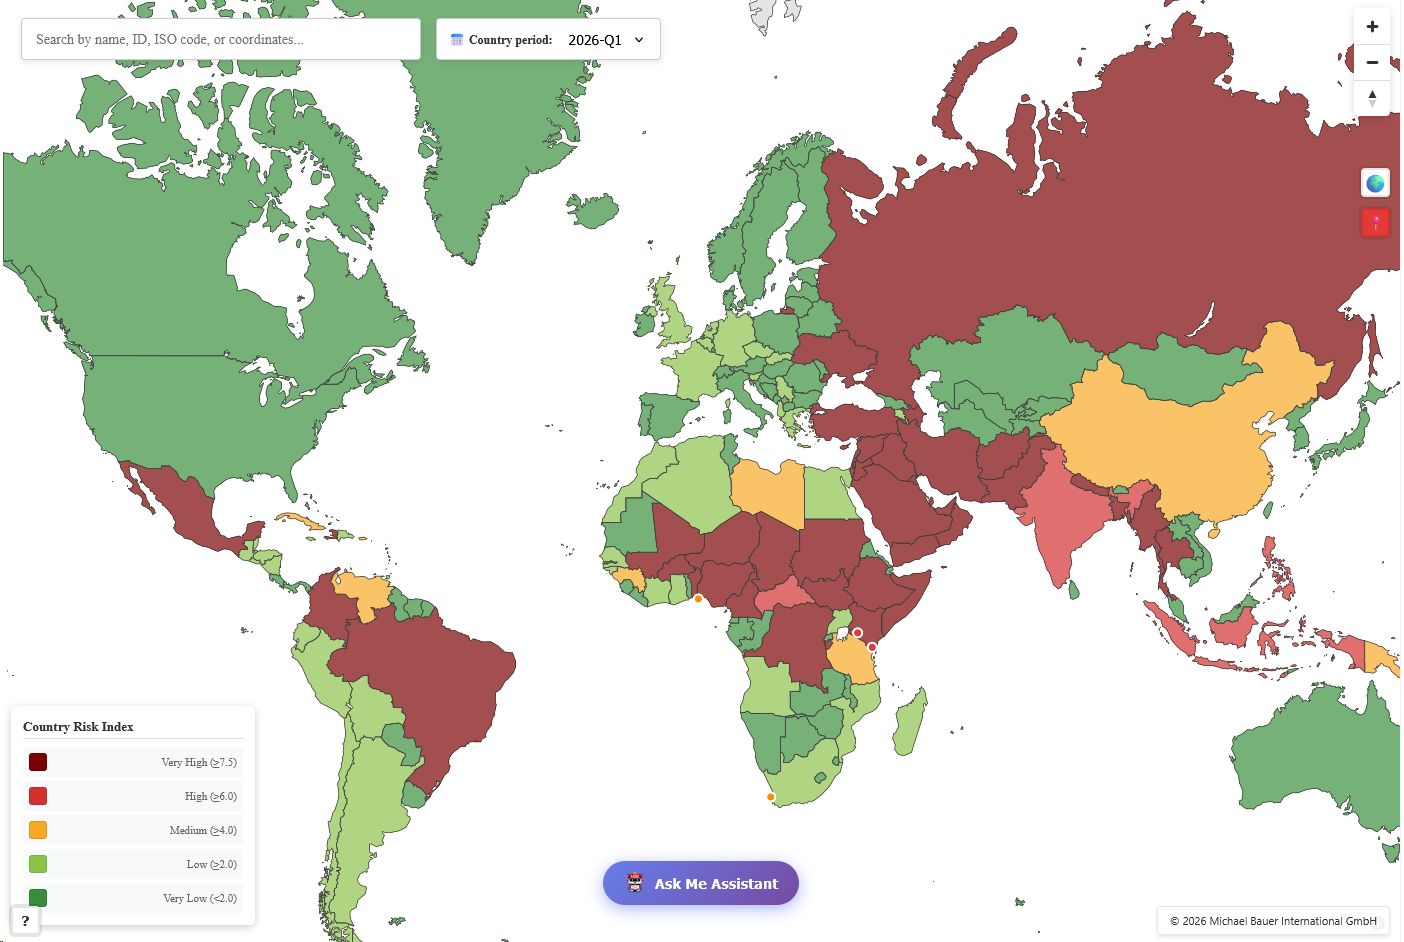
The application’s main interface is a world map which visualises the risk posed by political conflicts. Users can switch between a regional view, showing conflict intensity, and a national view. In the national view, the Country Risk Index provides a concise national-level overview of the conflict situation and can be used for risk assessment under the CER Directive on the Assessment of Critical Infrastructure (KRITIS), among other things. Risk analysts can navigate the map, select specific countries and regions, and view all conflicts in the respective area.
The dashboard distinguishes between conflicts that are violently carried out within a region and those that are relevant but not violent within that location. Violent conflicts are highlighted accordingly, making regional hotspots and escalation dynamics immediately visible.
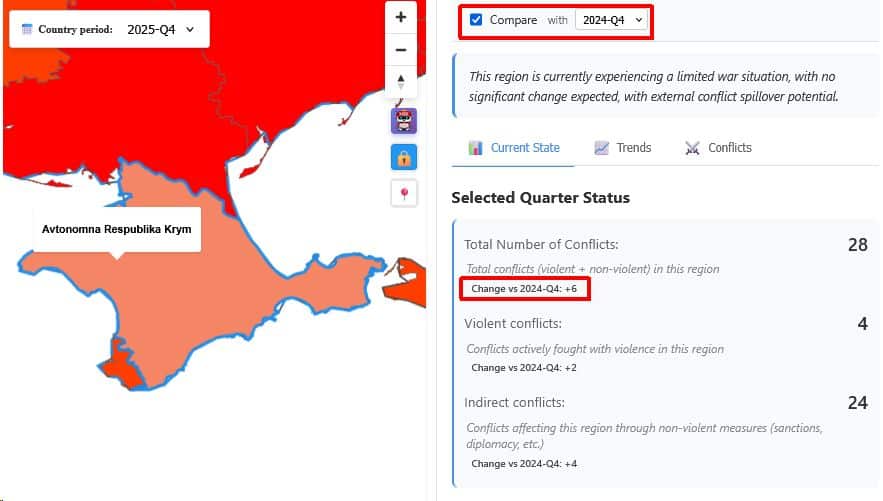
Comparison of time periods, countries, and regions
Users can track how conflict patterns evolve across multiple quarters and observe whether conflict dynamics intensify or ease in specific regions.
Countries and regions can also be compared directly, allowing for a systematic assessment of regional risk profiles.
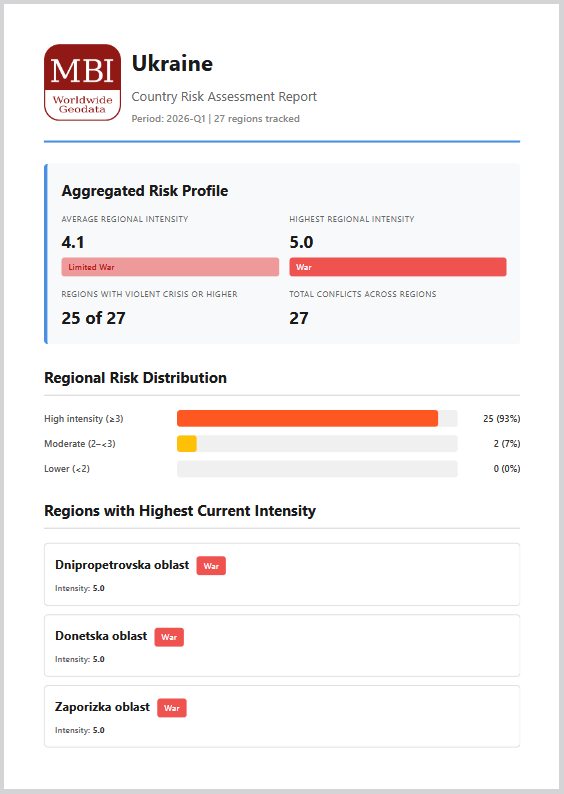
Export of PDF reports
Users can automatically generate country and regional reports and export them as PDF documents. These reports can be used for internal risk assessments, situational analyses, or management briefings.
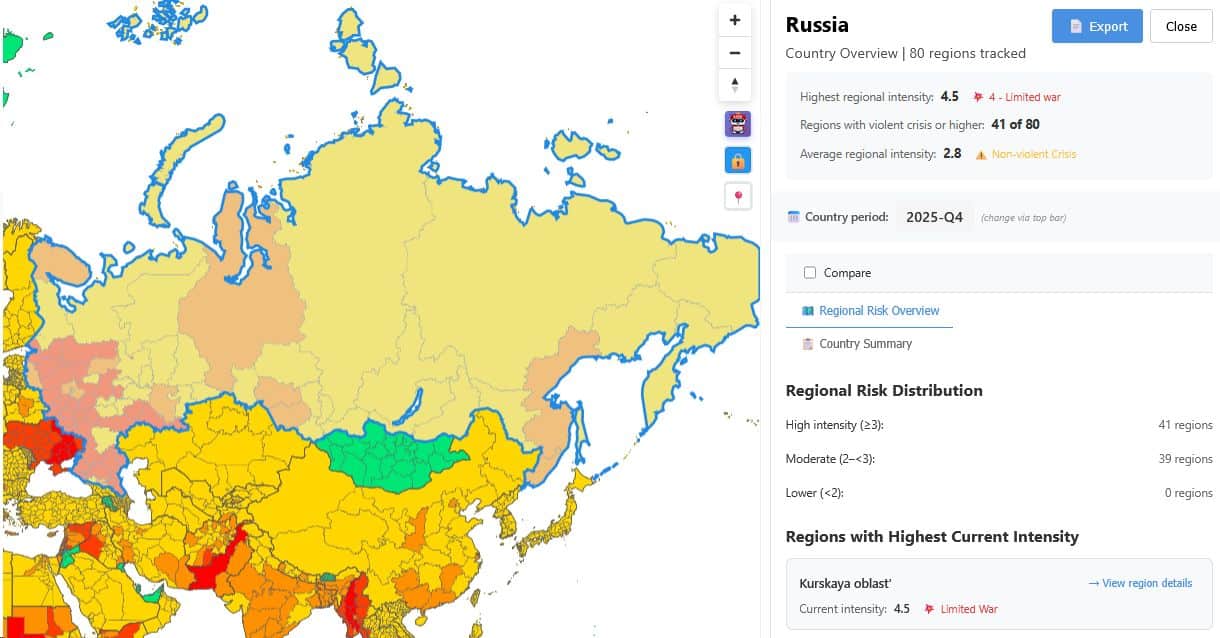
National and regional analysis
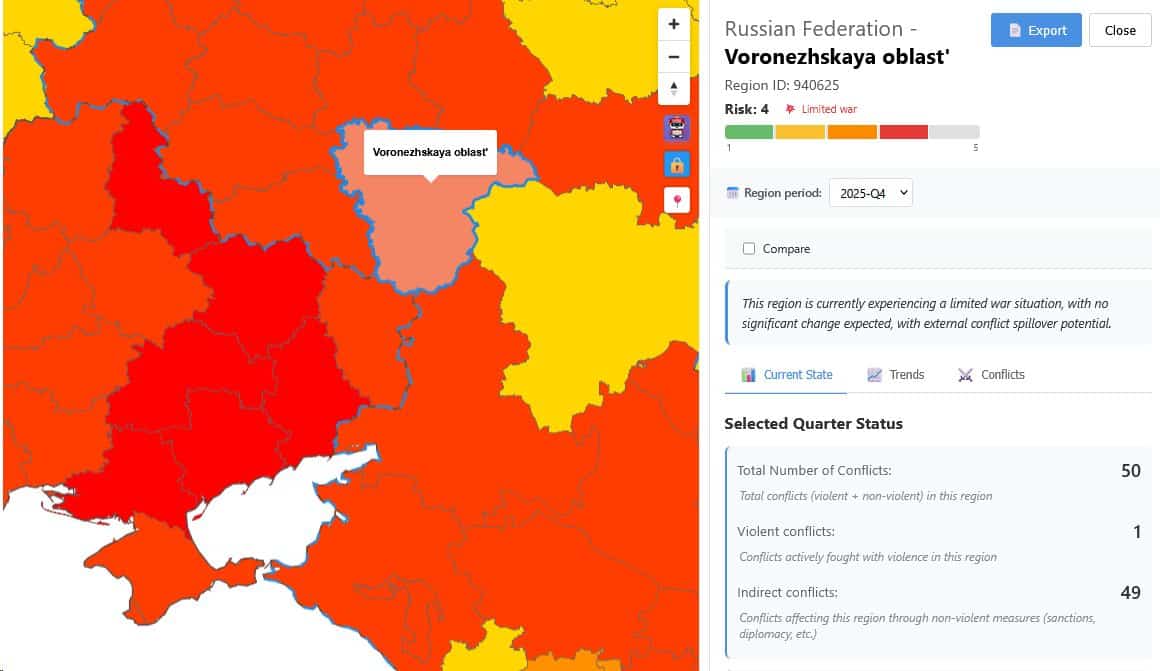
The subnational localization of conflicts reveals that violent conflicts often affect only certain regions within a country. While some areas may be heavily influenced by conflict dynamics, other parts of the country may remain relatively stable. This differentiation allows for a much more precise assessment of political risks and enables a more realistic evaluation of regional stability within countries.
The images show Russia at the national level and the Russian region Voronezhskaya Oblast’ at the regional level.
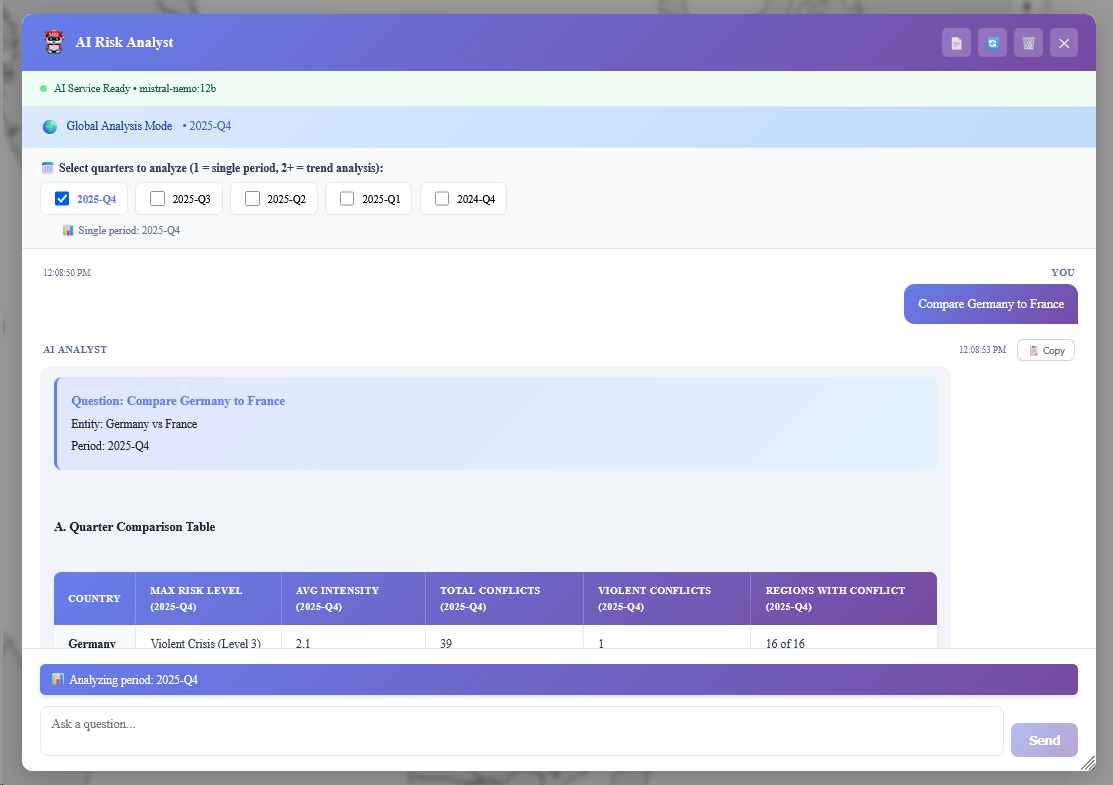
Chat function as an alternative way to access conflict data
An integrated chat function for data requests supports the analysis and helps users interpret complex conflict developments. The platform is designed to assist users in understanding geopolitical developments and making data-driven analyses more efficient.
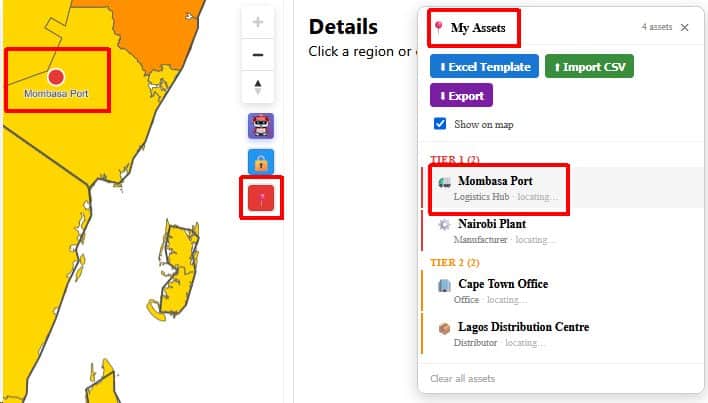
Integration of your own location lists
Organizations can integrate their own lists of locations, such as production sites, suppliers, or key transport hubs, into the analysis. This allows companies to monitor conflict dynamics in the vicinity of relevant business operations. All location data remains on users’ systems and is not transferred to external servers.
The data behind it
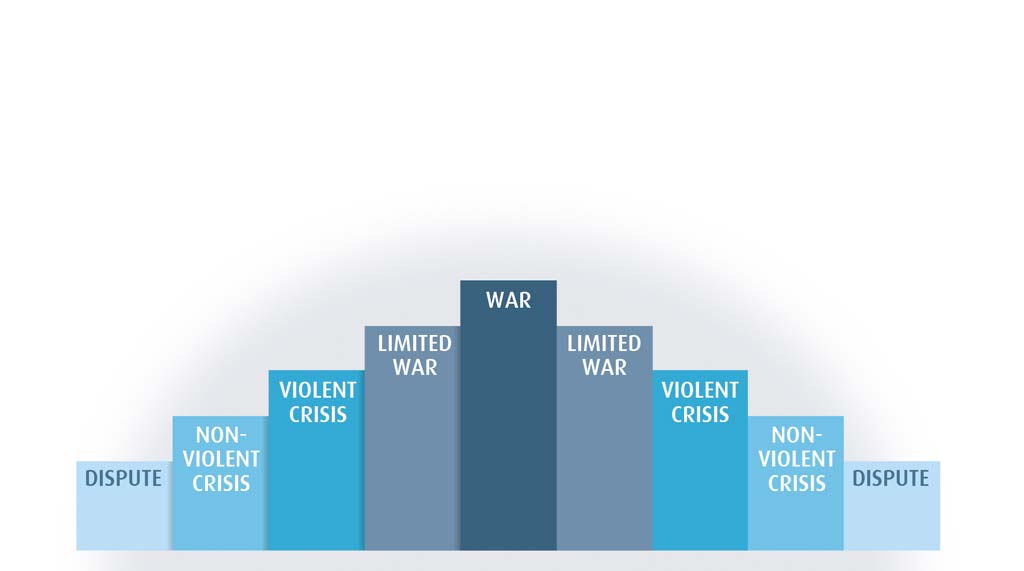
Classification into
levels of conflict
Data for more than
subnational units worldwide
Tracking of more than
ongoing conflicts
Recording of around
conflict-related events per year
A global Set of Conflict Data
The dataset captures political conflicts worldwide using a consistent methodology across all regions. It includes all countries of the world with subnational units as well as dependent territories.
- Conflict dynamics are globally comparable and regionally differentiated
- Quarterly updates (monthly updates available if required)
- To the best of our knowledge, the MBI CONIAS database is the only accessible dataset worldwide that provides a consistent global recording of political conflicts across all intensity levels
Key Differentiators

Globally consistent and comparable data

Strict quality control

Individual consulting and support

Continuous updating after every release

100 % GDPR compliant
TELL US WHERE YOU ARE HEADING.
WE WILL GLADLY ASSIST YOU IN SELECTING THE DATA NEEDED TO REACH YOUR GOAL.
Didn’t find what you are looking for or have another question? Please do not hesitate to contact us!
Our experts will be happy to advise you individually and without obligation on which data you can use to create added value for your company and realize savings.
Would you like to evaluate and visualize the data?