« All posts
« All press releases
News | Press | Purchasing Power
Purchasing Power in Europe Rises to €14.8 Trillion in 2025
02/27/2026
In 2025, Europeans have an average purchasing power of €18,768 per capita. At 3.5%, per capita purchasing power growth is lower than the previous year. On average, Europeans have €632 more at their disposal than 2024. But how significant are the differences between European countries? Which nations show the highest purchasing power – and which regions across Europe may offer new opportunities in 2026?
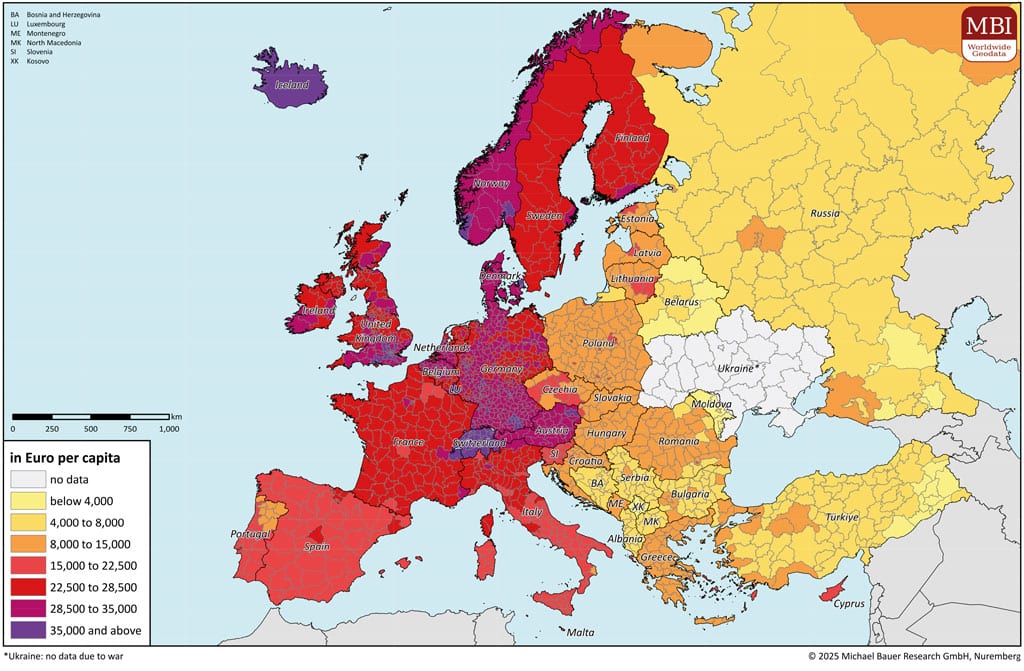
Purchasing Power Map of Europe
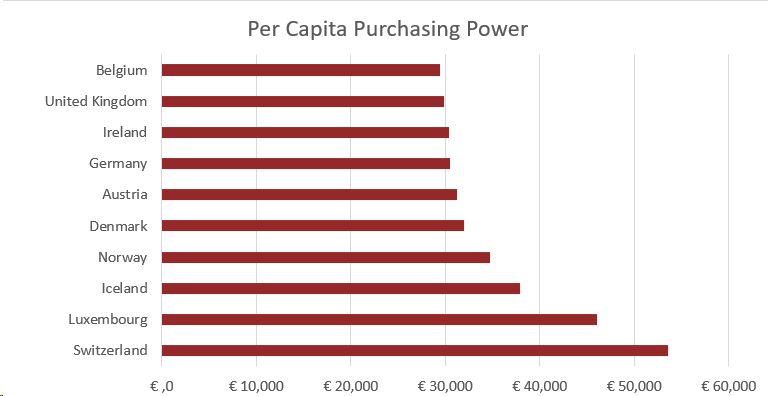
Purchasing Power Ranking Europe 2025 – Top 10 Countries
| Rank 2025 | Country | Population | Purchasing Power Index* |
| 1 | Switzerland | 9,021,529 | 286 |
| 2 | Luxembourg | 689,029 | 245 |
| 3 | Iceland | 380,735 | 202 |
| 4 | Norway | 5,580,976 | 185 |
| 5 | Denmark | 5,991,261 | 170 |
| 6 | Austria | 9,176,420 | 167 |
| 7 | Germany | 83,748,038 | 163 |
| 8 | Ireland | 5,400,154 | 162 |
| 9 | United Kingdom | 68,507,444 | 159 |
| 10 | Belgium | 11,876,021 | 157 |
*Index per capita; 100 = European average
Even within the top 10 of the Purchasing Power Ranking Europe 2025, significant differences become apparent. Switzerland, ranked first, shows nearly double the per capita purchasing power of Belgium in tenth place.
Across Europe as a whole, disparities become even more pronounced. Switzerland’s per capita purchasing power is approximately 14 times higher than that of the lowest-ranking country. The gap between the highest and lowest country amounts to €49,837 per capita.
Overall, 17 countries (approx. 40%) are above the European average with an index above 100, while 24 countries (approx. 60%) remain below this benchmark.
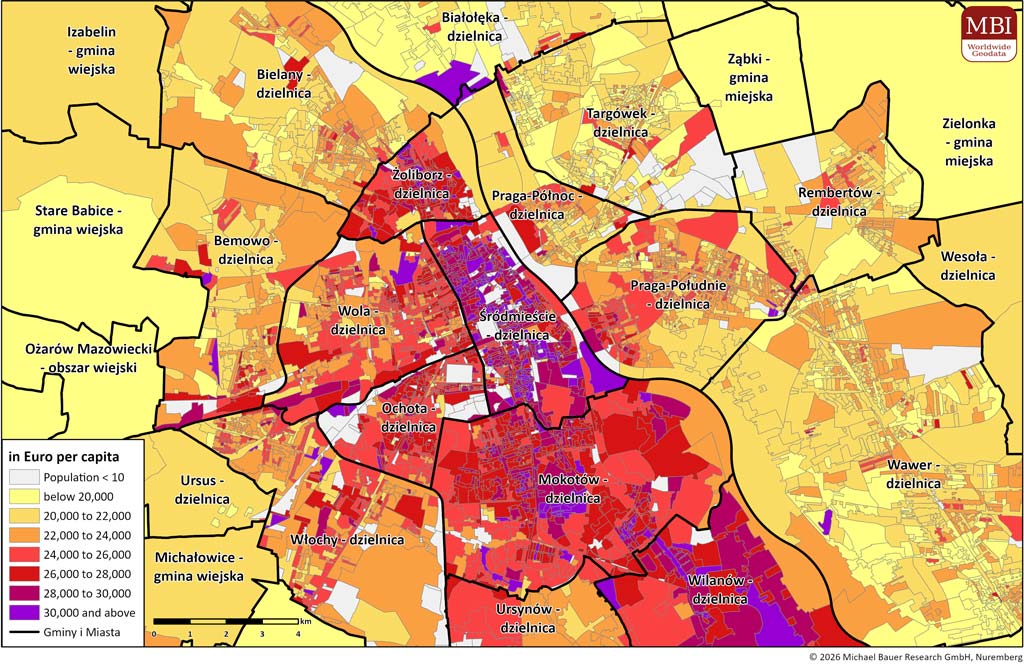
Purchasing Power Differences Within European Countries: The Example of Poland
Purchasing power disparities are visible not only between countries but also within individual nations across administrative, postal, and micro-geographic levels. National averages are not sufficient to reflect these internal differences and may conceal existing regional potential when used as the sole reference point.
Poland ranks 26th in the European comparison with a purchasing power index of 69, clearly below the European average. However, a regional perspective reveals a more differentiated picture:
| Rank 2025 | NUTS-3-Region | Population | National Purchasing Power Index* |
| 1 | Miasto Warszawa | 1,854,972 | 179 |
| 2 | Miasto Kraków | 805,615 | 143 |
| 3 | Miasto Poznań | 533,162 | 142 |
| 4 | Miasto Wrocław | 669,429 | 142 |
| 5 | Trójmiejski | 756,381 | 131 |
| 6 | Miasto Łódź | 641,568 | 123 |
| 7 | Warszawski Zachodni | 718,969 | 122 |
| 8 | Katowicki | 681,619 | 120 |
| 9 | Miasto Szczecin | 384,445 | 116 |
| 10 | Gliwicki | 431,034 | 112 |
* Index per capita, 100 = national average
While more rural areas show below-average purchasing power, the capital region of Warsaw reaches an index of 124 in the European comparison. Its purchasing power level exceeds that of numerous regions in France, the United Kingdom, Spain, and Italy.
Even more detailed insights are available at the postal code level:
The purchasing power data provided illustrates the importance of granular regional data in identifying disparities and uncovering additional market potential. Understanding and leveraging Europe’s regional diversity opens up new perspectives for expansion and growth in 2026.
Purchasing Power Europe 2025 as a Basis for Analysis in 2026
The figures presented in this article are an excerpt from MBI’s comprehensive Purchasing Power Europe 2025 dataset, now available. Together with additional market and risk data across up to five spatial levels, the purchasing power data provides companies in 2026 with a robust foundation for forecasting, strategic planning, and data-driven decision-making. Organizations across various industries use MBI’s globally standardized and internationally comparable purchasing power data for market and location analysis, international sales and expansion planning, potential assessment, and the structured evaluation of regional markets in a global context.
*Europe: This Europe total data set includes the 41 most important countries, excluding Ukraine (no data for 2025 due to war).