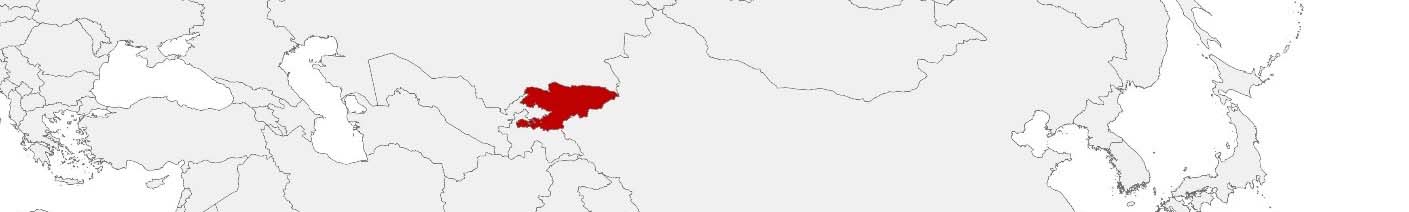
Kyrgyzstan Purchasing Power, Socio-demographics & Area Boundaries

Your trusted Source of Geodata for Kyrgyzstan for Postcode 4-digit and Rajondor
Discover a comprehensive suite of geodata for Kyrgyzstan from our extensive global data offering of sociodemographic and purchasing power data. Elevate your geomarketing, target group analyses, and location studies with our detailed insights. MBI provides accurate area boundaries (vector boundaries, polygons) with detailed, seamless coverage of the following areas: Postcode 4-digit and Rajondor. Our data’s global consistency and comparability enable you to draw comparisons between Kyrgyzstan and any other country worldwide. Additionally, political risk data allows you to develop targeted adaptation strategies to increase your location, logistics, and investment security.
Tailored for professionals in areas such as expansion planning, risk management, portfolio analysis, and statistical research, our data is accessible in all standard GIS formats and Excel. Licensed from MBI, this data ensures you have the robust information needed for strategic decision-making to drive your sales and business forward and maximize ROI.
Data that can currently be licensed from mbi for Kyrgyzstan
Each attribute or geographical level can be licensed individually.
| Geographic level | ||
|---|---|---|
| Area level | Administrative | Grid |
| Name | Rajondor | 100 x 100 m |
| Number of areas | 54 | |
| Geometry | ||
| Polygons | ||
| Data / Variables | ||
| Population | ||
| Age bands | ||
| Sex / Gender | ||
| Households | ||
| Purchasing power | ||
| Daytime Population | ||
| Political Risk | ||
| Get a quote | Get a quote | |
| Additional Political Risk Data by Regions | ||||
|---|---|---|---|---|
| Regions | SUSAFE Basic | Calculated Trends | Conflict Insights | |
| Self-Explaining Political Risk Data | 11 | |||
| Get a quote | Get a quote | Get a quote | Get a quote | |
Geodata for Kyrgyzstan: Facilitating Growth and Connectivity
Kyrgyzstan, with its rich cultural heritage and impressive mountain landscapes, is situated on the historic Silk Road, the ancient trade route between China and the Mediterranean region. The nation’s aspirations for economic resilience and growth, coupled with the need to address diverse development challenges, underscore the necessity for sophisticated geodata. MBI’s offerings for Kyrgyzstan are designed to bolster these development trajectories, providing critical insights for geomarketing, GIS, expansion planning, spatial analysis, transportation planning, location intelligence analysis, and risk management.
Geographical Levels and Products
MBI’s geodata for Kyrgyzstan is focused on the “Rajondor” (Districts) level. This granularity enables strategic analysis and planning across Kyrgyzstan’s diverse regions, facilitating informed decision-making. The available products include:
- Population and Daytime Population: Essential for understanding demographic trends and planning for social services, marketing campaigns, and educational needs across districts.
- Purchasing Power: Offers insights into the economic capabilities and consumer spending potential, aiding in market analysis and investment planning.
- Socio Demographics: Provides a comprehensive view of the population’s characteristics, supporting targeted development and marketing initiatives.
- Digital Boundaries: Key for accurate mapping and spatial analysis, facilitating infrastructure development and strategic planning.
Country-Specific Insights
In Kyrgyzstan, where development priorities include enhancing agricultural productivity, improving infrastructure, and fostering a digital economy, detailed geodata is invaluable. Insights into district-level economic capabilities and demographic patterns can inform policies and initiatives aimed at boosting rural and urban economies, promoting sustainable agricultural practices, and enhancing digital connectivity. Additionally, digital boundary data stands to support the planning and implementation of infrastructure projects, ensuring they align with Kyrgyzstan’s growth objectives and sustainability commitments.
Why Use Geodata from MBI for Kyrgyzstan
MBI’s geodata for Kyrgyzstan provide vital insights into the nation’s demographic, economic, and geographical landscape, whether for advancing rural development, promoting economic diversification, or enhancing public services.
Advantages of our administrative Boundaries
- Worldwide, seamless coverage of postal and administrative boundaries
- The layers are topographically correct and country borders fit seamlessly together without overlaps and gaps
- Data and areas can be easily combined in one layer thanks to a unique key, enabling cross-country analysis
- Constant updates guarantee a current data status
- The vintage compatibility between the MBI boundaries and the MBI Sociodemographic and Purchasing Power data is guaranteed
- Simple update by uniform layout of the layer names
- The higher-level area hierarchies are included with the boundary files
- Digital boundaries are in a vector format to allow visualization in any zoom levels
Smart Combination
The territorial vintages of the worldwide area boundaries are compatible with our globally consistent and comparable socio-economic data. We offer you a reliable basis for well-founded and data-based decisions. If desired, we can integrate the MBI data directly into our digital boundaries. So, you can load them directly into your system without any additional steps and use them immediately.
COUNTRY AVAILABILITY
Europe | North America | South America | Asia | Oceania | Africa
DATA FORMATS
Tab delimited file (TXT) | KML | Access database (MDB) | Excel (xls) | Esri Shapefile (.shp) | Esri Geodatabase (.gdb) | MapInfo (.tab, .tabx) | MapInfo MIF/MID | GeoJSON | GeoParquet (.parquet) | GeoPackage (.gpkg) | more on request
> LEARN MORE
TELL US WHERE YOU ARE HEADING.
WE WILL GLADLY ASSIST YOU IN SELECTING THE DATA NEEDED TO REACH YOUR GOAL.
Didn’t find what you are looking for or have another question? Please do not hesitate to contact us!
Our experts will be happy to advise you individually and without obligation on which data you can use to create added value for your company and realize savings.
Would you like to evaluate and visualize the data?