
Global Area Boundaries
DIGITAL BOUNDARIES AS THE BASIS FOR YOUR DATA
Digital area boundaries help you to display and analyze spatial areas on a map. They can easily be matched and attributed with company internal data (e.g. sales figures, sales areas) or SOCIODEMOGRAPHIC DATA and PURCHASING POWER data.
Area boundaries are an essential tool for all businesses today. As a seamless collection of spatial data which enables cross border analysis, valid area boundaries are needed to accurately analyze a store or business locations. They also provide a valuable input into targeted marketing campaigns and the visualization of their impacts. Without proper and correct area definition, whether these are POSTCODE or ADMINISTRATIVE BOUNDARIES, the key statistics that impact a business performance cannot be properly measured. In some cases, it’s even more critical knowing what’s happening in the direct vicinity of a location than on an admin or post code level. The so-called SMALL AREA MAPS (MICRO AREAS) are ideal for these applications, as they are generally smaller subdivisions of the postcode or administrative boundaries.
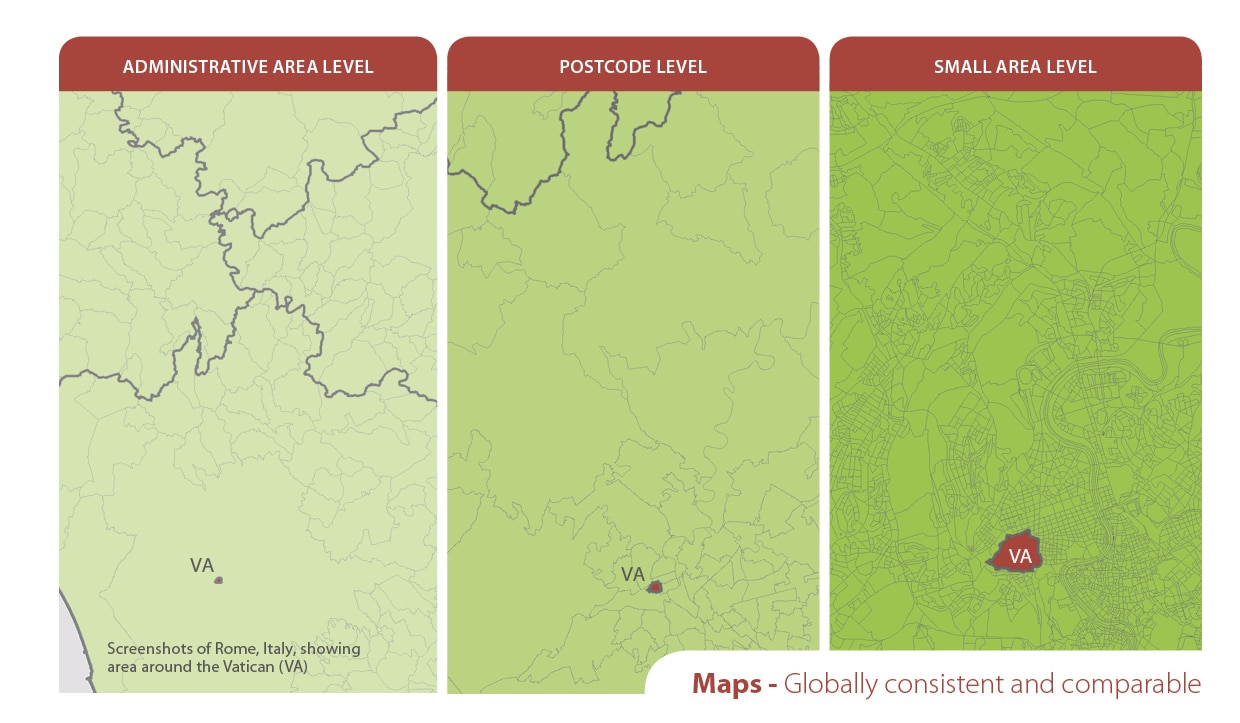
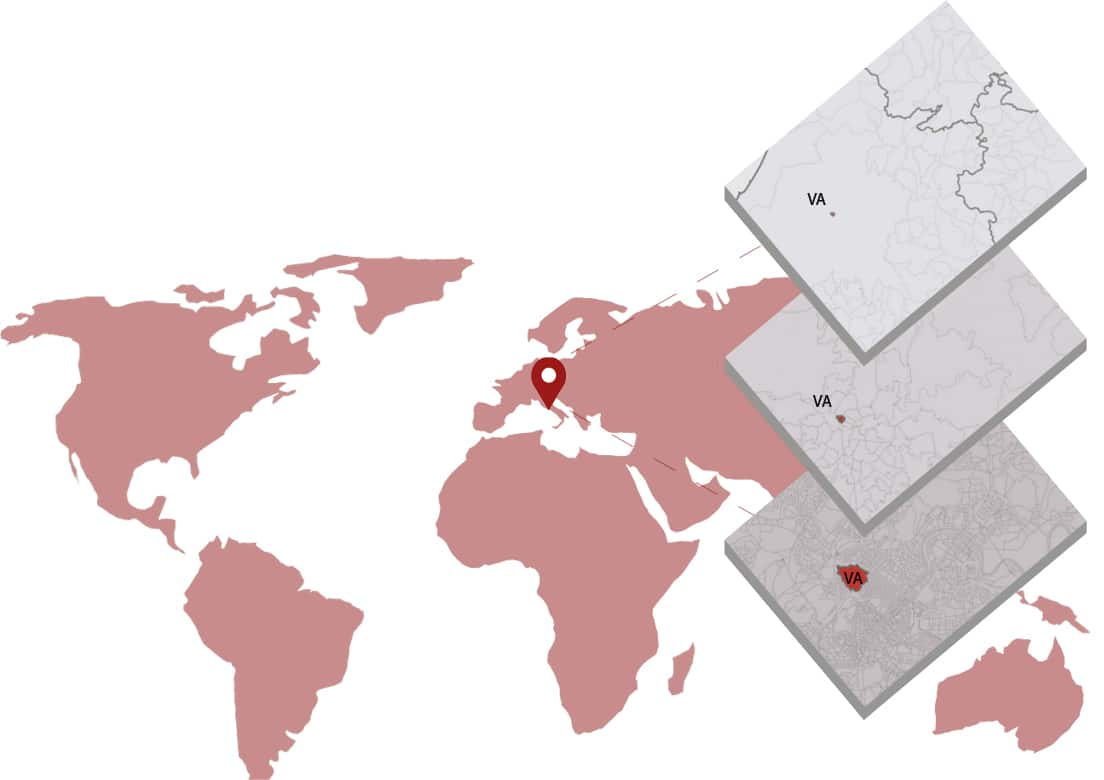
GLOBAL BOUNDARY LEVELS
- POSTCODE (ZIP) BOUNDARY MAPS | Worldwide postal areas are geographic boundaries that define the geographic area for each postcode | Example of Spain: 5-digit Postcode Areas
- ADMINISTRATIVE AREA MAPS | Municipality boundaries plus the higher levels like provinces and state boundaries | Example of Spain: Municipios-boundaries plus the higher levels Provincias, Comunidades and Agrupaciones
- SMALL AREA MAPS (MICRO AREAS) | Could be subdivisions of the postcode or administrative boundaries like census areas | Example of Spain: Census Sections, a subdivision of the Municipios
VAST VARIETY OF USES IN MANY ASPECTS OF BUSINESS APPLICATIONS
Our area boundaries provide you with a consistent basis for visualizing your data for various tasks and applications, such as
- Sales planning
- Sales controlling
- Site planning
- Expansion planning
- Branch network planning
- Customer visualization
- Predictive analytics
- Insurance risk management
- Thematic mapping
- Social Media Marketing
- Postcode look-up tables
- Internet applications
- Geocoding and Reverse Geocoding
Advantages of our Area Boundaries
- Worldwide, seamless coverage of postal and administrative boundaries
- The layers are topographically correct and country borders fit seamlessly together without overlaps and gaps
- Data and areas can be easily combined in one layer thanks to a unique key, enabling cross-country analysis
- Constant updates guarantee a current data status
- The vintage compatibility between the boundaries and the Sociodemographic and Purchasing Power data is guaranteed
- Simple update by uniform layout of the layer names
- The higher-level area hierarchies are included with the boundary files
- Digital boundaries are in a vector format to allow visualization in any zoom levels
Smart Combination
The territorial vintages of the worldwide area boundaries are compatible with our globally consistent and comparable socio-economic data. We offer you the best basis for well-founded and data-based decisions. If desired, we can integrate the data directly into our digital boundaries. So, you can load them directly into your system without any additional steps and use them immediately.
Key Differentiators

Globally consistent and comparable data

Strict quality control

Individual consulting and support

Continuous updating after every release

100 % GDPR compliant
COUNTRY AVAILABILITY
Europe | North America | South America | Asia | Oceania | Africa
DATA FORMATS
Tab delimited file (TXT) | KML | Access database (MDB) | Excel (xls) | Esri Shapefile (.shp) | Esri Geodatabase (.gdb) | MapInfo (.tab) | MapInfo MIF/MID | more on request
DATALINK API
Easy access to a variety of MBI data
• Datalink Desktop
• Datalink Rest API